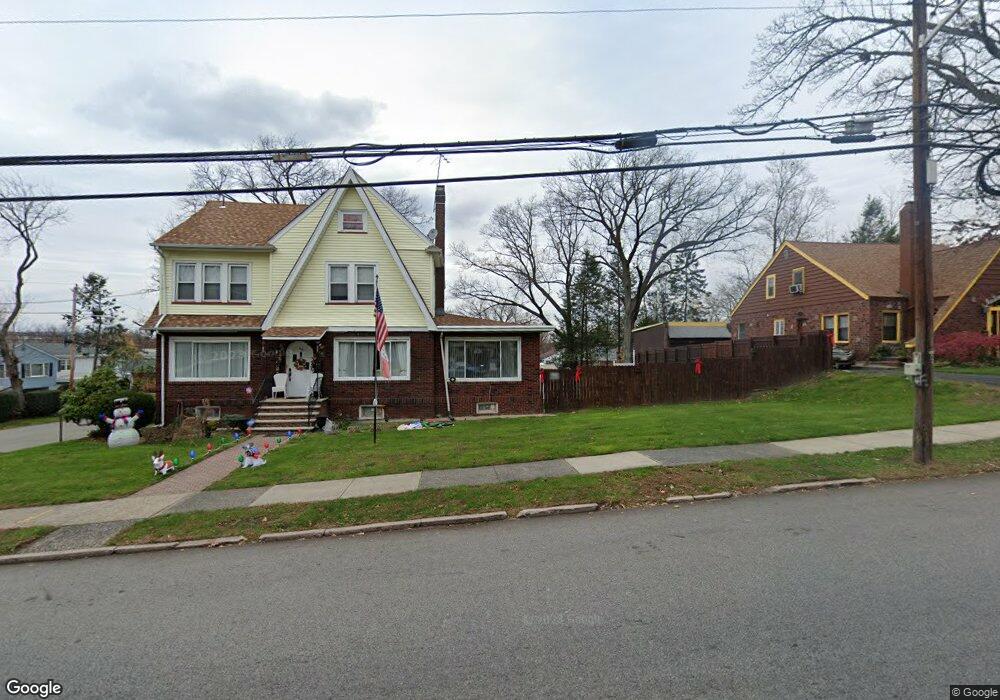
689 11th Ave Unit 691 Paterson, NJ 07514
Eastside NeighborhoodEstimated Value: $584,000 - $870,000
6
Beds
6
Baths
3,637
Sq Ft
$216/Sq Ft
Est. Value
About This Home
This home is located at 689 11th Ave Unit 691, Paterson, NJ 07514 and is currently estimated at $787,140, approximately $216 per square foot. 689 11th Ave Unit 691 is a home located in Passaic County with nearby schools including Edward W. Kilpatrick School of Discovery, Dale Avenue Elementary School, and Paterson School 6.
Ownership History
Date
Name
Owned For
Owner Type
Purchase Details
Closed on
May 14, 2018
Sold by
Uno Digital Llc
Bought by
Reyna Reed Lawrence and Reyna Valeriano
Current Estimated Value
Home Financials for this Owner
Home Financials are based on the most recent Mortgage that was taken out on this home.
Original Mortgage
$301,600
Outstanding Balance
$259,779
Interest Rate
4.6%
Mortgage Type
New Conventional
Estimated Equity
$527,361
Purchase Details
Closed on
Jul 29, 2017
Sold by
Williams Marcus
Bought by
Uno Digital Llc
Home Financials for this Owner
Home Financials are based on the most recent Mortgage that was taken out on this home.
Original Mortgage
$243,100
Interest Rate
3.96%
Mortgage Type
New Conventional
Purchase Details
Closed on
Jun 29, 2009
Sold by
Williams Roy C
Bought by
Williams Marcus Wray
Create a Home Valuation Report for This Property
The Home Valuation Report is an in-depth analysis detailing your home's value as well as a comparison with similar homes in the area
Home Values in the Area
Average Home Value in this Area
Purchase History
| Date | Buyer | Sale Price | Title Company |
|---|---|---|---|
| Reyna Reed Lawrence | $377,000 | Acres Land Title Agency Inc | |
| Uno Digital Llc | $240,000 | Rms Title Services Llc | |
| Williams Marcus Wray | -- | -- |
Source: Public Records
Mortgage History
| Date | Status | Borrower | Loan Amount |
|---|---|---|---|
| Open | Reyna Reed Lawrence | $301,600 | |
| Previous Owner | Uno Digital Llc | $243,100 |
Source: Public Records
Tax History Compared to Growth
Tax History
| Year | Tax Paid | Tax Assessment Tax Assessment Total Assessment is a certain percentage of the fair market value that is determined by local assessors to be the total taxable value of land and additions on the property. | Land | Improvement |
|---|---|---|---|---|
| 2025 | $17,878 | $350,900 | $108,800 | $242,100 |
| 2024 | $17,205 | $350,900 | $108,800 | $242,100 |
| 2022 | $16,289 | $350,900 | $108,800 | $242,100 |
| 2021 | $15,706 | $350,900 | $108,800 | $242,100 |
| 2020 | $14,650 | $350,900 | $108,800 | $242,100 |
| 2019 | $14,175 | $342,900 | $105,900 | $237,000 |
| 2018 | $14,635 | $338,300 | $105,000 | $233,300 |
| 2017 | $13,973 | $335,900 | $104,500 | $231,400 |
| 2016 | $15,356 | $353,900 | $109,300 | $244,600 |
| 2015 | $14,538 | $353,900 | $109,300 | $244,600 |
| 2014 | -- | $430,000 | $197,500 | $232,500 |
Source: Public Records
Map
Nearby Homes
- 39 E 39th St Unit 8G
- 39 E 39th St Unit 412
- 39 E 39th St
- 39 E 39th St Unit 617
- 39 E 39th St Unit 1E
- 39 E 39th St Unit 2L
- 98-108 E 38th St
- 5 Park Rd
- 5-23 Canger Place Unit 1X
- 089 Morlot Ave
- 5-33 1st St Unit 1X
- 723-725 Broadway
- 5-08 5th St Unit 1X
- 4-10 Morlot Ave Unit 1X
- 10-06 Essex Place Unit 1X
- 7-04 4th St Unit 1X
- 447-449 E 27th St
- 100 Parkview Ave
- 277 E 32nd St Unit 279
- 10-22 2nd St Unit 1X
- 697 11th Ave Unit 699
- 697 11th Ave
- 691 11th Ave
- 701 11th Ave Unit 703
- 47 E 37th St Unit 51
- 681-683 11th Ave
- 681 11th Ave Unit 683
- 41 E 37th St Unit 45
- 50 E 37th St Unit 52
- 43 E 37th St
- 44-52 E 38th St
- 46 E 37th St Unit 48
- 698 11th Ave Unit 704
- 71 E 37th St Unit 77
- 677 11th Ave Unit 679
- 44 E 38th St Unit 52
- 46-48 E 37th St
- 35 E 37th St Unit 39
- 682 11th Ave Unit 684
- 55 E 38th St