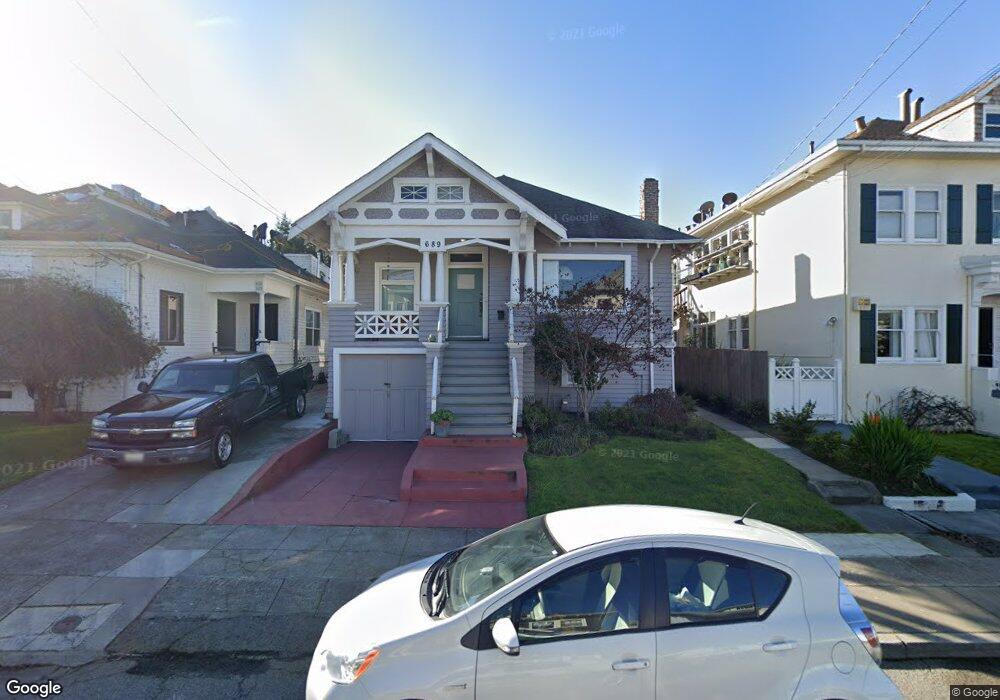
689 62nd St Oakland, CA 94609
Bushrod NeighborhoodEstimated Value: $924,000 - $1,024,000
3
Beds
1
Bath
1,499
Sq Ft
$643/Sq Ft
Est. Value
About This Home
This home is located at 689 62nd St, Oakland, CA 94609 and is currently estimated at $964,131, approximately $643 per square foot. 689 62nd St is a home located in Alameda County with nearby schools including Sankofa United Elementary School, Peralta Elementary School, and Claremont Middle School.
Ownership History
Date
Name
Owned For
Owner Type
Purchase Details
Closed on
Jan 2, 2024
Sold by
Willis Michael Anthony
Bought by
Michael Anthony Willis Trust and Willis
Current Estimated Value
Purchase Details
Closed on
May 6, 2020
Sold by
Williams Milton Leon
Bought by
Milton Leon Williams Revocable Trust and Gray-Smith
Purchase Details
Closed on
May 6, 2019
Sold by
Williams Gray Smith Melvia and Williams Gray Melvia
Bought by
Gray Smith Melvia and Melvia Gray Smith Revocable Tr
Purchase Details
Closed on
Jul 28, 2015
Sold by
Touson Nanearl W
Bought by
Touson Nanearl F Williams and 2015 Revocable Living Trust
Create a Home Valuation Report for This Property
The Home Valuation Report is an in-depth analysis detailing your home's value as well as a comparison with similar homes in the area
Home Values in the Area
Average Home Value in this Area
Purchase History
| Date | Buyer | Sale Price | Title Company |
|---|---|---|---|
| Michael Anthony Willis Trust | -- | None Listed On Document | |
| Milton Leon Williams Revocable Trust | -- | None Listed On Document | |
| Gray Smith Melvia | -- | None Available | |
| Touson Nanearl F Williams | -- | None Available |
Source: Public Records
Tax History
| Year | Tax Paid | Tax Assessment Tax Assessment Total Assessment is a certain percentage of the fair market value that is determined by local assessors to be the total taxable value of land and additions on the property. | Land | Improvement |
|---|---|---|---|---|
| 2025 | $2,591 | $59,332 | $37,512 | $21,820 |
| 2024 | $2,591 | $58,169 | $36,776 | $21,393 |
| 2023 | $2,589 | $57,028 | $36,055 | $20,973 |
| 2022 | $2,446 | $55,910 | $35,348 | $20,562 |
| 2021 | $2,178 | $54,814 | $34,655 | $20,159 |
| 2020 | $2,152 | $54,252 | $34,300 | $19,952 |
| 2019 | $1,970 | $53,189 | $33,628 | $19,561 |
| 2018 | $1,934 | $52,145 | $32,968 | $19,177 |
| 2017 | $1,823 | $51,123 | $32,322 | $18,801 |
| 2016 | $1,666 | $50,121 | $31,688 | $18,433 |
| 2015 | $1,653 | $49,368 | $31,212 | $18,156 |
| 2014 | $1,550 | $48,401 | $30,601 | $17,800 |
Source: Public Records
Map
Nearby Homes
- 6300 Shattuck Ave Unit 1
- 6320 Shattuck Ave
- 667 Alcatraz Ave
- 5914 Martin Luther King jr Way
- 667 & 667A Alcatraz Ave
- 3233 Ellis St
- 5812 Dover St
- 6555 Shattuck Ave
- 6015 Adeline St
- 558 58th St
- 629 66th St
- 2124 Prince St
- 5707 Carberry Ave
- 574 Aileen St
- 636 56th St
- 491 Mcauley St
- 3214 California St
- 604 56th St
- 5718 Adeline St
- 5659 Telegraph Ave
Your Personal Tour Guide
Ask me questions while you tour the home.