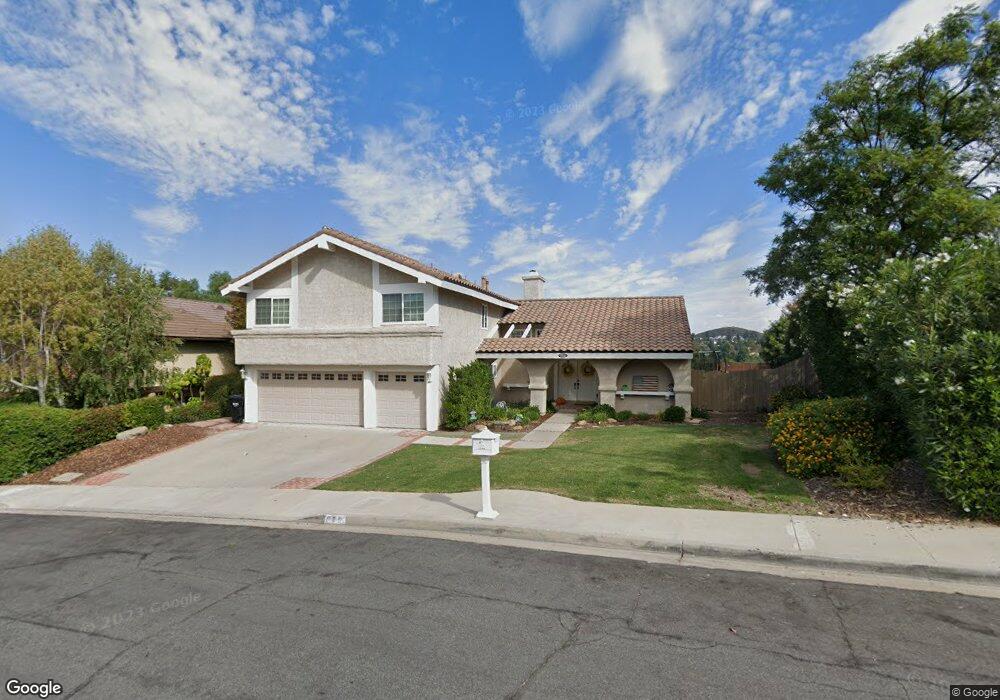
689 Whipsering Oaks Place Thousand Oaks, CA 91320
Estimated Value: $1,255,000 - $1,337,522
4
Beds
3
Baths
2,824
Sq Ft
$458/Sq Ft
Est. Value
About This Home
This home is located at 689 Whipsering Oaks Place, Thousand Oaks, CA 91320 and is currently estimated at $1,292,381, approximately $457 per square foot. 689 Whipsering Oaks Place is a home located in Ventura County with nearby schools including Aspen Elementary School, Redwood Middle School, and Sequoia Middle School.
Ownership History
Date
Name
Owned For
Owner Type
Purchase Details
Closed on
Jul 21, 2016
Sold by
Posen Craig M and Posen Ronna S
Bought by
Culkin Kyle and Culkin Alana
Current Estimated Value
Home Financials for this Owner
Home Financials are based on the most recent Mortgage that was taken out on this home.
Original Mortgage
$624,000
Outstanding Balance
$495,555
Interest Rate
3.42%
Mortgage Type
New Conventional
Estimated Equity
$796,826
Purchase Details
Closed on
Jun 23, 2002
Sold by
Posen Craig M and Posen Ronna S
Bought by
Posen Craig M and Posen Ronna S
Purchase Details
Closed on
Apr 26, 1997
Sold by
Murdzak Clement P
Bought by
Posen Craig and Posen Ronna S
Home Financials for this Owner
Home Financials are based on the most recent Mortgage that was taken out on this home.
Original Mortgage
$175,000
Interest Rate
8.15%
Purchase Details
Closed on
Sep 19, 1995
Sold by
Murdzak Clement P and Murdzak Patricia A
Bought by
Murdzak Clement P and Murdzak Patricia A
Create a Home Valuation Report for This Property
The Home Valuation Report is an in-depth analysis detailing your home's value as well as a comparison with similar homes in the area
Home Values in the Area
Average Home Value in this Area
Purchase History
| Date | Buyer | Sale Price | Title Company |
|---|---|---|---|
| Culkin Kyle | $780,000 | Wfg National Title Company | |
| Posen Craig M | -- | -- | |
| Posen Craig | $305,000 | Investors Title Company | |
| Murdzak Clement P | -- | -- |
Source: Public Records
Mortgage History
| Date | Status | Borrower | Loan Amount |
|---|---|---|---|
| Open | Culkin Kyle | $624,000 | |
| Previous Owner | Posen Craig | $175,000 |
Source: Public Records
Tax History Compared to Growth
Tax History
| Year | Tax Paid | Tax Assessment Tax Assessment Total Assessment is a certain percentage of the fair market value that is determined by local assessors to be the total taxable value of land and additions on the property. | Land | Improvement |
|---|---|---|---|---|
| 2025 | $10,288 | $905,252 | $588,415 | $316,837 |
| 2024 | $10,288 | $887,502 | $576,877 | $310,625 |
| 2023 | $9,997 | $870,100 | $565,565 | $304,535 |
| 2022 | $9,804 | $853,040 | $554,476 | $298,564 |
| 2021 | $9,613 | $836,314 | $543,604 | $292,710 |
| 2020 | $9,128 | $827,740 | $538,031 | $289,709 |
| 2019 | $8,884 | $811,511 | $527,482 | $284,029 |
| 2018 | $8,702 | $795,600 | $517,140 | $278,460 |
| 2017 | $8,527 | $780,000 | $507,000 | $273,000 |
| 2016 | $4,812 | $419,602 | $167,837 | $251,765 |
| 2015 | $4,723 | $413,301 | $165,317 | $247,984 |
| 2014 | $4,704 | $405,207 | $162,080 | $243,127 |
Source: Public Records
Map
Nearby Homes
- 718 Pamela Wood St
- 325 Cherry Hills Ct
- 607 Valley Oak Ln
- 865 Palmgrove Ave
- 816 Pamela Wood St
- 603 Racquet Club Ln
- 559 Racquet Club Ln
- 722 Blue Oak Ave
- 809 Shadow Lake Dr
- 254 Greenmeadow Dr
- 214 Poplar Crest Ave
- 656 Blue Oak Ave
- 224 Marjori Ave
- 216 Windrose Ct
- 942 Woodlawn Dr
- 1044 Larry Ct
- 1091 Amberton Ln Unit 58
- 1095 Amberton Ln
- 769 Birchpark Cir Unit 203
- 1193 Ramona Dr
- 689 Whispering Oaks Place
- 683 Whispering Oaks Place
- 695 Whispering Oaks Place
- 682 Oak Shadow View Place
- 679 Whispering Oaks Place
- 701 Whispering Oaks Place
- 688 Oak Shadow View Place
- 676 Oak Shadow View Place
- 696 Whispering Oaks Place
- 690 Whispering Oaks Place
- 694 Oak Shadow View Place
- 684 Whispering Oaks Place
- 675 Whispering Oaks Place
- 292 Windtree Ave
- 306 Windtree Ave
- 700 Oak Shadow View Place
- 678 Whispering Oaks Place
- 280 Windtree Ave
- 318 Windtree Ave
- 672 Whispering Oaks Place