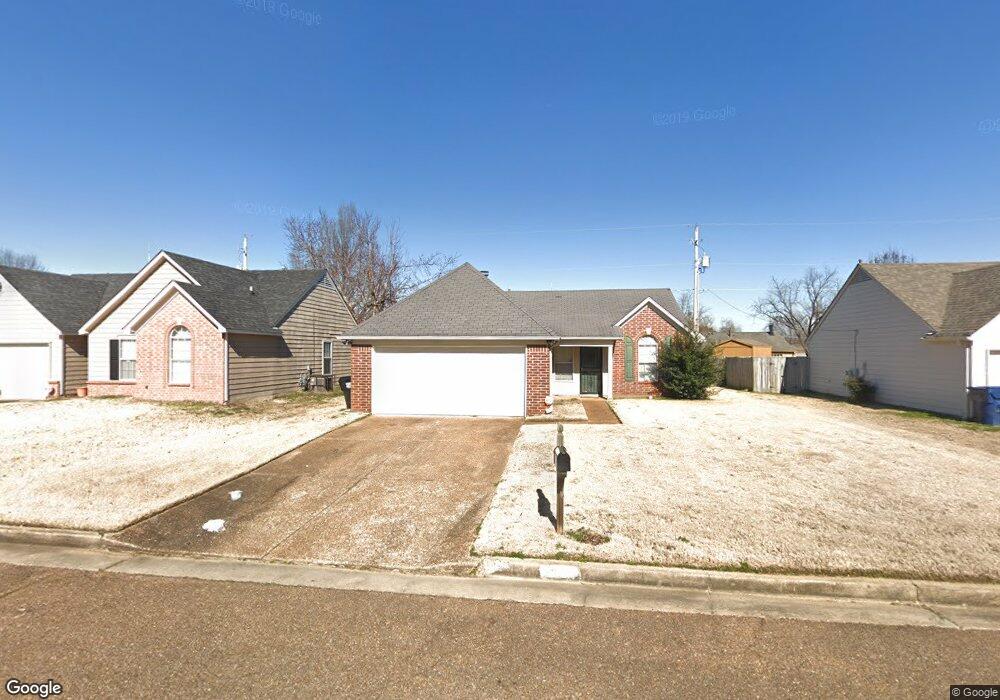
6898 Lagrange Cir S Cordova, TN 38018
Cordova NeighborhoodEstimated Value: $201,739 - $215,000
3
Beds
2
Baths
1,238
Sq Ft
$168/Sq Ft
Est. Value
About This Home
This home is located at 6898 Lagrange Cir S, Cordova, TN 38018 and is currently estimated at $207,685, approximately $167 per square foot. 6898 Lagrange Cir S is a home located in Shelby County with nearby schools including Dexter Elementary School, Dexter Middle School, and Cordova High School.
Ownership History
Date
Name
Owned For
Owner Type
Purchase Details
Closed on
May 11, 2022
Sold by
Boyd Gerald W and Boyd Melinda J
Bought by
Boyd Revocable Living Trust
Current Estimated Value
Purchase Details
Closed on
Mar 3, 2011
Sold by
The Secretary Of Housing & Urban Develop
Bought by
Boyd Gerald W and Boyd Melinda J
Purchase Details
Closed on
Jun 30, 2010
Sold by
Bullock Tiwana Michelle and Bullock Destan Lavell
Bought by
Secretary Of Housing & Urban Development
Purchase Details
Closed on
May 26, 2006
Sold by
Goldman William Hal and Shelton Betty J
Bought by
Hud
Purchase Details
Closed on
Sep 25, 1996
Sold by
Paragon Properties Llc
Bought by
Goldman William Hal and Shelton Betty J
Home Financials for this Owner
Home Financials are based on the most recent Mortgage that was taken out on this home.
Original Mortgage
$88,226
Interest Rate
8.05%
Mortgage Type
FHA
Create a Home Valuation Report for This Property
The Home Valuation Report is an in-depth analysis detailing your home's value as well as a comparison with similar homes in the area
Home Values in the Area
Average Home Value in this Area
Purchase History
| Date | Buyer | Sale Price | Title Company |
|---|---|---|---|
| Boyd Revocable Living Trust | -- | Patterson Bray Pllc | |
| Boyd Gerald W | $68,000 | None Available | |
| Secretary Of Housing & Urban Development | $95,465 | None Available | |
| Hud | $98,488 | None Available | |
| Goldman William Hal | $87,900 | -- | |
| Goldman William Hal | $87,900 | -- |
Source: Public Records
Mortgage History
| Date | Status | Borrower | Loan Amount |
|---|---|---|---|
| Previous Owner | Goldman William Hal | $88,226 |
Source: Public Records
Tax History Compared to Growth
Tax History
| Year | Tax Paid | Tax Assessment Tax Assessment Total Assessment is a certain percentage of the fair market value that is determined by local assessors to be the total taxable value of land and additions on the property. | Land | Improvement |
|---|---|---|---|---|
| 2025 | $1,226 | $48,725 | $6,500 | $42,225 |
| 2024 | $1,226 | $36,175 | $5,325 | $30,850 |
| 2023 | $1,226 | $36,175 | $5,325 | $30,850 |
| 2022 | $1,226 | $36,175 | $5,325 | $30,850 |
| 2021 | $1,248 | $36,175 | $5,325 | $30,850 |
| 2020 | $1,015 | $25,050 | $5,325 | $19,725 |
| 2019 | $1,015 | $25,050 | $5,325 | $19,725 |
| 2018 | $1,015 | $25,050 | $5,325 | $19,725 |
| 2017 | $1,030 | $25,050 | $5,325 | $19,725 |
| 2016 | $1,006 | $23,025 | $0 | $0 |
| 2014 | $1,006 | $23,025 | $0 | $0 |
Source: Public Records
Map
Nearby Homes
- 6916 Lagrange Pines Rd
- 6838 Lagrange Cir N
- 7035 S Estacada Way
- 1382 Exbury Dr
- 6774 Whitten Pine Dr
- 6884 Wrigley Dr
- 6880 Wrigley Dr
- 6890 Century Oaks Dr
- 7194 Charlton Way
- 6452 Macon Rd
- 7412 Lost Trail Dr
- 7407 Lost Grove Ln
- 7410 Appling Rain Dr
- 1339 Mullins Station Rd
- 7426 Lost Trail Dr
- 6378 Limewood Ave
- 6336 Gillham Dr
- 6336 Limewood Ave
- 7520 Crystal Lake Dr
- 1321 Winter Springs Ln
- 6904 Lagrange Cir S
- 6892 Lagrange Cir S
- 6901 Lagrange Hill Rd
- 6910 Lagrange Cir S
- 6886 Lagrange Cir S
- 6907 Lagrange Hill Rd
- 6895 Lagrange Hill Rd
- 6899 Lagrange Cir S
- 6893 Lagrange Cir S
- 6905 Lagrange Cir S
- 6913 Lagrange Hill Rd
- 6889 Lagrange Hill Rd
- 6916 Lagrange Cir S
- 6880 Lagrange Cir S
- 6885 Lagrange Cir S
- 6911 Lagrange Cir S
- 6911 Lagrange Pines Dr
- 6919 Lagrange Hill Rd
- 6883 Lagrange Hill Rd
- 6881 Lagrange Cir S