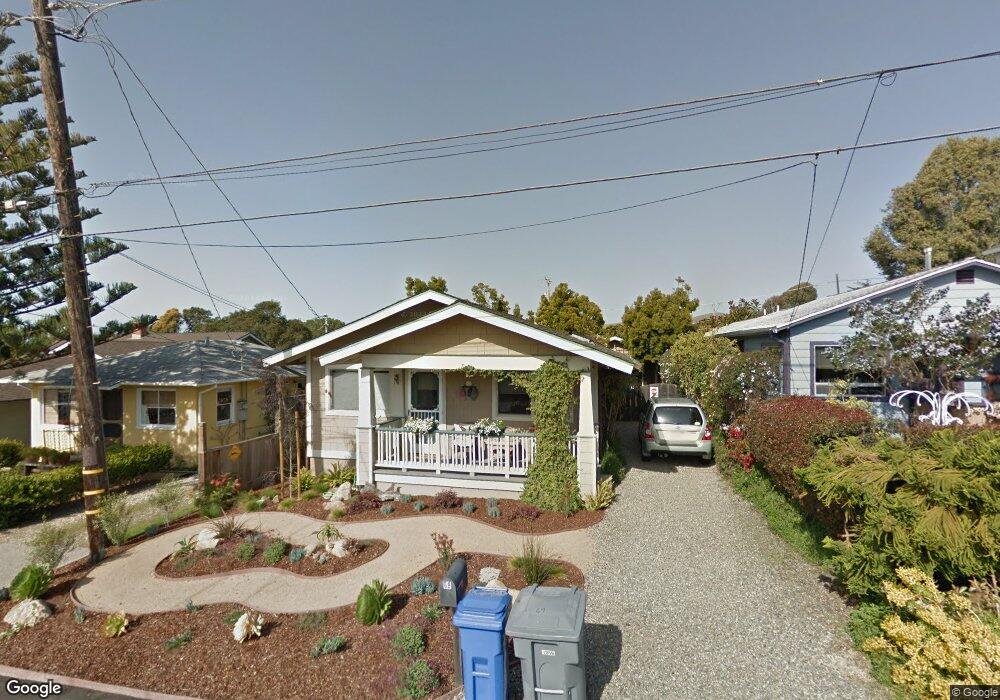
69 11th St Cayucos, CA 93430
Cayucos NeighborhoodEstimated Value: $1,018,000 - $1,808,000
2
Beds
1
Bath
700
Sq Ft
$2,197/Sq Ft
Est. Value
About This Home
This home is located at 69 11th St, Cayucos, CA 93430 and is currently estimated at $1,537,653, approximately $2,196 per square foot. 69 11th St is a home located in San Luis Obispo County.
Ownership History
Date
Name
Owned For
Owner Type
Purchase Details
Closed on
Nov 30, 2023
Sold by
Susan M Swendseid Trust and Slover Beverly Jay
Bought by
Slover Beverly Jay and Wilkerson Rae
Current Estimated Value
Purchase Details
Closed on
Apr 25, 2011
Sold by
Mcgrath Roger N and Mcgrath Kay H
Bought by
Swendseid Susan M
Purchase Details
Closed on
May 28, 1999
Sold by
Haeuser Karl and Haeuser Helen
Bought by
Mcgrath Roger N and Mcgrath Kay H
Create a Home Valuation Report for This Property
The Home Valuation Report is an in-depth analysis detailing your home's value as well as a comparison with similar homes in the area
Home Values in the Area
Average Home Value in this Area
Purchase History
We collect this data history from publicly available records. To have your information removed, we recommend requesting removal directly through your county’s website.
| Date | Buyer | Sale Price | Title Company |
|---|---|---|---|
| Slover Beverly Jay | -- | None Listed On Document | |
| Swendseid Susan M | $650,000 | First American Title Company | |
| Mcgrath Roger N | $240,000 | Chicago Title Co |
Source: Public Records
Tax History
| Year | Tax Paid | Tax Assessment Tax Assessment Total Assessment is a certain percentage of the fair market value that is determined by local assessors to be the total taxable value of land and additions on the property. | Land | Improvement |
|---|---|---|---|---|
| 2025 | $17,579 | $1,708,500 | $1,326,000 | $382,500 |
| 2024 | $11,975 | $1,675,000 | $1,300,000 | $375,000 |
| 2023 | $11,975 | $1,122,000 | $867,000 | $255,000 |
| 2022 | $11,774 | $1,100,000 | $850,000 | $250,000 |
| 2021 | $7,331 | $650,979 | $503,031 | $147,948 |
| 2020 | $6,907 | $644,305 | $497,874 | $146,431 |
| 2019 | $6,770 | $631,672 | $488,112 | $143,560 |
| 2018 | $6,635 | $619,288 | $478,542 | $140,746 |
| 2017 | $6,502 | $607,146 | $469,159 | $137,987 |
| 2016 | $6,372 | $595,242 | $459,960 | $135,282 |
| 2015 | $6,316 | $586,301 | $453,051 | $133,250 |
| 2014 | $6,093 | $574,817 | $444,177 | $130,640 |
Source: Public Records
Map
Nearby Homes
Your Personal Tour Guide
Ask me questions while you tour the home.