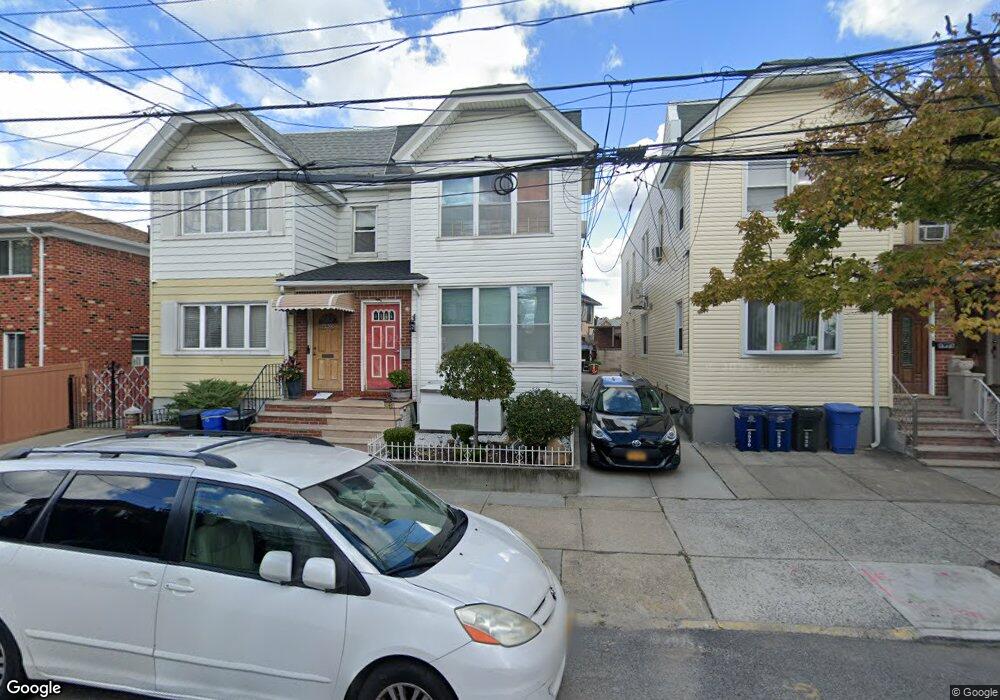
69-35 78th St Flushing, NY 11379
Middle Village NeighborhoodEstimated Value: $923,106 - $1,072,000
6
Beds
3
Baths
1,620
Sq Ft
$615/Sq Ft
Est. Value
About This Home
This home is located at 69-35 78th St, Flushing, NY 11379 and is currently estimated at $995,527, approximately $614 per square foot. 69-35 78th St is a home located in Queens County with nearby schools including P.S. 87 - Middle Village, Queens Metropolitan High School, and Elm Community Charter School.
Ownership History
Date
Name
Owned For
Owner Type
Purchase Details
Closed on
Nov 29, 2011
Sold by
Trocchia Anthony and Trocchia Maria
Bought by
Dyndor Jacek and Dyndor Kinga
Current Estimated Value
Home Financials for this Owner
Home Financials are based on the most recent Mortgage that was taken out on this home.
Original Mortgage
$530,250
Outstanding Balance
$362,727
Interest Rate
4.01%
Mortgage Type
Purchase Money Mortgage
Estimated Equity
$632,800
Create a Home Valuation Report for This Property
The Home Valuation Report is an in-depth analysis detailing your home's value as well as a comparison with similar homes in the area
Home Values in the Area
Average Home Value in this Area
Purchase History
| Date | Buyer | Sale Price | Title Company |
|---|---|---|---|
| Dyndor Jacek | $545,000 | -- |
Source: Public Records
Mortgage History
| Date | Status | Borrower | Loan Amount |
|---|---|---|---|
| Open | Dyndor Jacek | $530,250 |
Source: Public Records
Tax History Compared to Growth
Tax History
| Year | Tax Paid | Tax Assessment Tax Assessment Total Assessment is a certain percentage of the fair market value that is determined by local assessors to be the total taxable value of land and additions on the property. | Land | Improvement |
|---|---|---|---|---|
| 2025 | $7,426 | $38,159 | $11,218 | $26,941 |
| 2024 | $7,426 | $36,974 | $10,391 | $26,583 |
| 2023 | $7,081 | $35,254 | $10,032 | $25,222 |
| 2022 | $6,694 | $55,140 | $14,940 | $40,200 |
| 2021 | $6,695 | $45,720 | $14,940 | $30,780 |
| 2020 | $6,731 | $50,280 | $14,940 | $35,340 |
| 2019 | $6,446 | $48,420 | $14,940 | $33,480 |
| 2018 | $5,989 | $29,378 | $10,317 | $19,061 |
| 2017 | $5,697 | $27,945 | $10,248 | $17,697 |
| 2016 | $5,300 | $27,945 | $10,248 | $17,697 |
| 2015 | $2,960 | $26,499 | $11,433 | $15,066 |
| 2014 | $2,960 | $25,677 | $13,294 | $12,383 |
Source: Public Records
Map
Nearby Homes