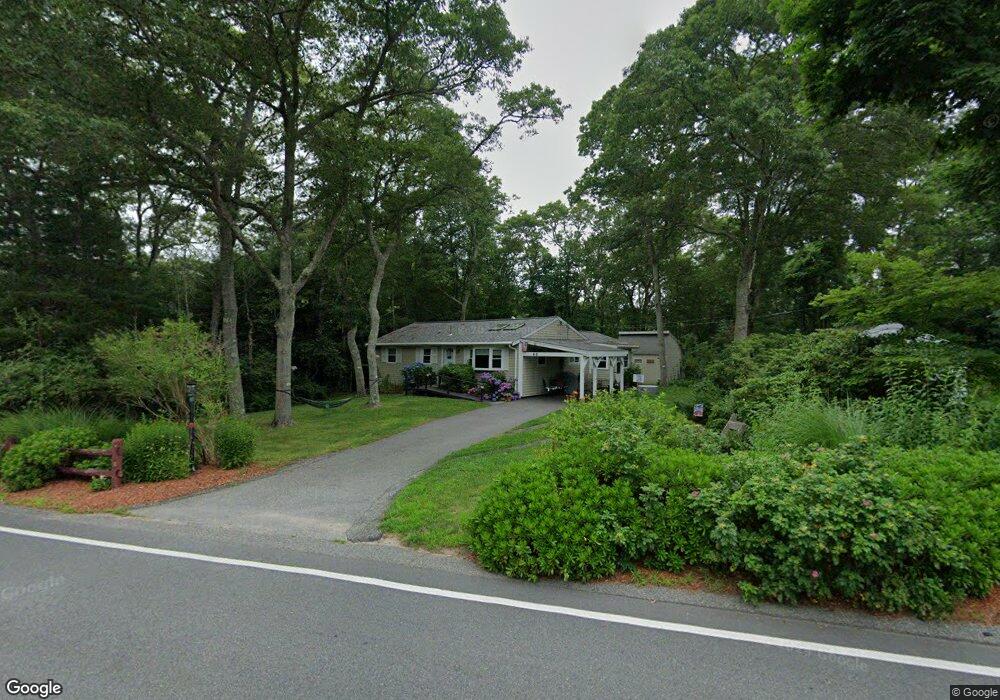
69 Clay Pond Rd Buzzards Bay, MA 02532
Monument Beach NeighborhoodEstimated Value: $467,590 - $548,000
4
Beds
1
Bath
1,102
Sq Ft
$468/Sq Ft
Est. Value
About This Home
This home is located at 69 Clay Pond Rd, Buzzards Bay, MA 02532 and is currently estimated at $516,148, approximately $468 per square foot. 69 Clay Pond Rd is a home located in Barnstable County with nearby schools including Bourne High School, Cadence Academy Preschool - Bourne, and St Margaret Regional School.
Ownership History
Date
Name
Owned For
Owner Type
Purchase Details
Closed on
May 23, 2024
Sold by
Scott A Fitzmaurice Lt and Fitzmaurice
Bought by
Scott A Fitzmaurice Lt and Fitzmaurice
Current Estimated Value
Purchase Details
Closed on
May 6, 2023
Sold by
Fitzmaurice Brian K and Fitzmaurice Kevin S
Bought by
S A Fitzmaurice 2021 Lt
Home Financials for this Owner
Home Financials are based on the most recent Mortgage that was taken out on this home.
Original Mortgage
$305,500
Interest Rate
6.32%
Mortgage Type
New Conventional
Create a Home Valuation Report for This Property
The Home Valuation Report is an in-depth analysis detailing your home's value as well as a comparison with similar homes in the area
Home Values in the Area
Average Home Value in this Area
Purchase History
| Date | Buyer | Sale Price | Title Company |
|---|---|---|---|
| Scott A Fitzmaurice Lt | -- | None Available | |
| Scott A Fitzmaurice Lt | -- | None Available | |
| Scott A Fitzmaurice Lt | -- | None Available | |
| S A Fitzmaurice 2021 Lt | -- | None Available | |
| S A Fitzmaurice 2021 Lt | -- | None Available | |
| S A Fitzmaurice 2021 Lt | -- | None Available |
Source: Public Records
Mortgage History
| Date | Status | Borrower | Loan Amount |
|---|---|---|---|
| Previous Owner | S A Fitzmaurice 2021 Lt | $305,500 |
Source: Public Records
Tax History
| Year | Tax Paid | Tax Assessment Tax Assessment Total Assessment is a certain percentage of the fair market value that is determined by local assessors to be the total taxable value of land and additions on the property. | Land | Improvement |
|---|---|---|---|---|
| 2025 | $2,865 | $366,800 | $178,600 | $188,200 |
| 2024 | $2,801 | $349,300 | $170,100 | $179,200 |
| 2023 | $2,725 | $309,300 | $150,600 | $158,700 |
| 2022 | $2,617 | $259,400 | $133,200 | $126,200 |
| 2021 | $2,544 | $236,200 | $121,200 | $115,000 |
| 2020 | $2,466 | $229,600 | $120,100 | $109,500 |
| 2019 | $2,349 | $223,500 | $120,100 | $103,400 |
| 2018 | $2,192 | $208,000 | $114,400 | $93,600 |
| 2017 | $2,063 | $200,300 | $107,600 | $92,700 |
| 2016 | $1,991 | $196,000 | $107,600 | $88,400 |
| 2015 | $1,860 | $184,700 | $96,300 | $88,400 |
Source: Public Records
Map
Nearby Homes
- 61 Thom Ave
- 93 Valley Bars Rd
- 18 Douglas Ave
- 16 Amberwood Ct
- 566 Shore Rd
- 203 County Rd
- 12 Turnberry Rd Unit 12
- 39 Bennets Neck Dr
- 13 Laurel Hill Ct
- 26 Carnoustie Rd
- 4 Hollyhock Knoll Ct Unit 4
- 4 Hollyhock Knoll Ct Unit 4
- 1 Hollyhock Knoll Ct Unit 1
- 5 Sea Knoll Ct
- 709 County Rd
- 3 1st St
- 14 Navajo Rd
- 254 Barlows Landing Rd
- 3 4th Ave
- 7 4th Ave
- 73 Clay Pond Rd
- 57 Clay Pond Rd
- 57 Clay Pond Rd
- 66 Clay Pond Rd
- 77 Clay Pond Rd
- 70 Clay Pond Rd Unit B
- 66 Clay Pond Rd
- 76 Clay Pond Rd
- 76 Clay Pond Rd
- 60 Clay Pond Rd
- 79 Clay Pond Rd
- 55 Clay Pond Rd
- 55 Clay Pond Rd
- 82 Clay Pond Rd
- 8 Cliff Rd
- 8 Cliff Rd
- 56 Clay Pond Rd
- 41 Thom Ave
- 56 Clay Pond Rd
- 37 Thom Ave