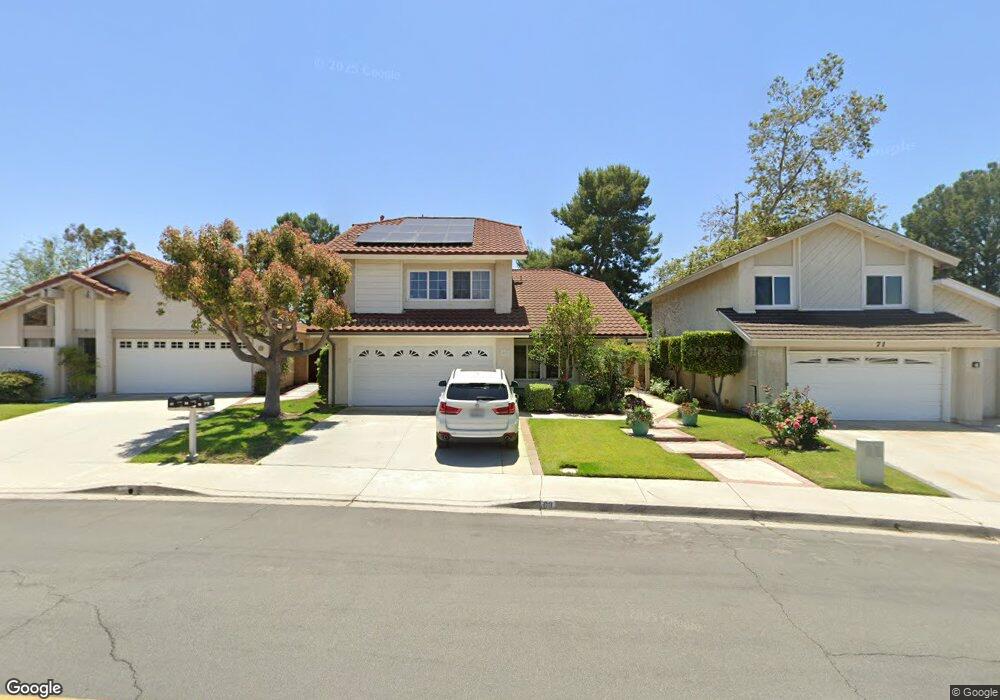
69 Diamante Irvine, CA 92620
Northwood NeighborhoodEstimated Value: $1,524,000 - $2,084,000
4
Beds
4
Baths
2,653
Sq Ft
$671/Sq Ft
Est. Value
About This Home
This home is located at 69 Diamante, Irvine, CA 92620 and is currently estimated at $1,780,583, approximately $671 per square foot. 69 Diamante is a home located in Orange County with nearby schools including Santiago Hills Elementary School, Sierra Vista Middle School, and Northwood High School.
Ownership History
Date
Name
Owned For
Owner Type
Purchase Details
Closed on
Oct 5, 1999
Sold by
Terence Lo and Terence Phyllis
Bought by
Bai Yan and Gao Xue
Current Estimated Value
Home Financials for this Owner
Home Financials are based on the most recent Mortgage that was taken out on this home.
Original Mortgage
$240,000
Interest Rate
7.68%
Purchase Details
Closed on
Dec 19, 1991
Sold by
Shannon William P and Shannon Victoria A
Bought by
Lo Terence and Lo Phyllis
Create a Home Valuation Report for This Property
The Home Valuation Report is an in-depth analysis detailing your home's value as well as a comparison with similar homes in the area
Home Values in the Area
Average Home Value in this Area
Purchase History
| Date | Buyer | Sale Price | Title Company |
|---|---|---|---|
| Bai Yan | $319,000 | Fidelity National Title Ins | |
| Lo Terence | $305,000 | United Title Co |
Source: Public Records
Mortgage History
| Date | Status | Borrower | Loan Amount |
|---|---|---|---|
| Closed | Bai Yan | $240,000 |
Source: Public Records
Tax History
| Year | Tax Paid | Tax Assessment Tax Assessment Total Assessment is a certain percentage of the fair market value that is determined by local assessors to be the total taxable value of land and additions on the property. | Land | Improvement |
|---|---|---|---|---|
| 2025 | $5,954 | $572,281 | $284,308 | $287,973 |
| 2024 | $5,954 | $561,060 | $278,733 | $282,327 |
| 2023 | $5,799 | $550,059 | $273,267 | $276,792 |
| 2022 | $5,685 | $539,274 | $267,909 | $271,365 |
| 2021 | $5,553 | $528,700 | $262,655 | $266,045 |
| 2020 | $5,522 | $523,279 | $259,961 | $263,318 |
| 2019 | $5,398 | $513,019 | $254,864 | $258,155 |
| 2018 | $5,301 | $502,960 | $249,866 | $253,094 |
| 2017 | $5,191 | $493,099 | $244,967 | $248,132 |
| 2016 | $4,961 | $483,431 | $240,164 | $243,267 |
| 2015 | $4,833 | $476,170 | $236,557 | $239,613 |
| 2014 | $4,738 | $466,843 | $231,923 | $234,920 |
Source: Public Records
Map
Nearby Homes
Your Personal Tour Guide
Ask me questions while you tour the home.