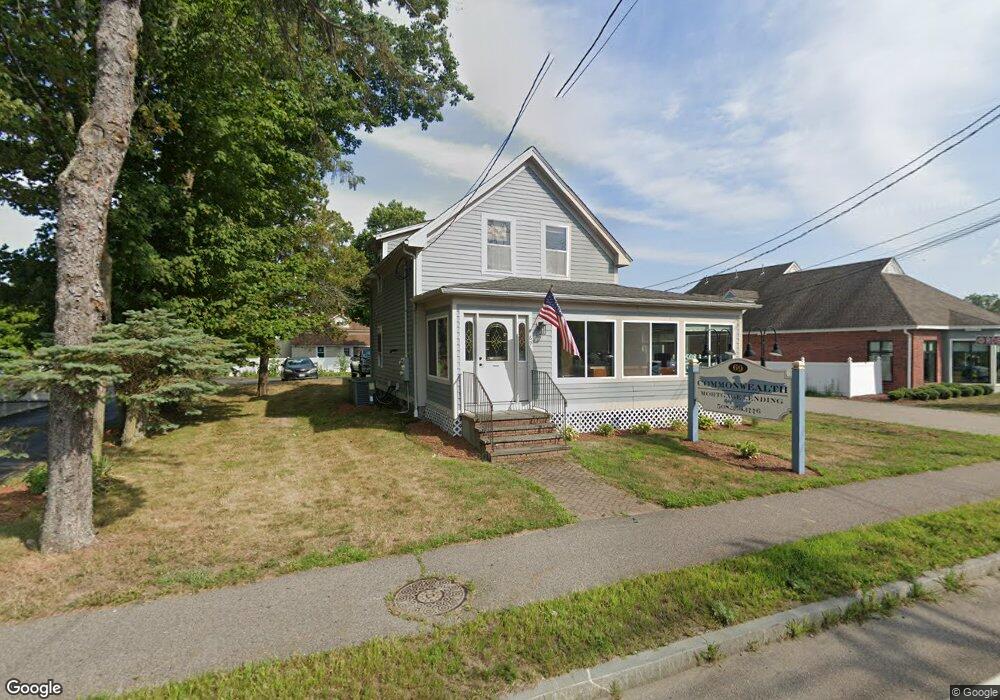
69 E Main St Westborough, MA 01581
Estimated Value: $329,000
3
Beds
1
Bath
1,370
Sq Ft
$240/Sq Ft
Est. Value
About This Home
This home is located at 69 E Main St, Westborough, MA 01581 and is currently priced at $329,000, approximately $240 per square foot. 69 E Main St is a home located in Worcester County with nearby schools including Westborough High School, Ebridge Montessori School, and Westboro Knowledge Beginnings.
Ownership History
Date
Name
Owned For
Owner Type
Purchase Details
Closed on
Jul 7, 2009
Sold by
Mitchell Rita F Est and Connors
Bought by
Commonwealth Mtg Lendi
Current Estimated Value
Purchase Details
Closed on
Feb 6, 2009
Sold by
Mitchell Rita F Est and Mitchell
Bought by
Commonwealth Mtg Lend
Home Financials for this Owner
Home Financials are based on the most recent Mortgage that was taken out on this home.
Original Mortgage
$280,000
Interest Rate
5.2%
Mortgage Type
Commercial
Create a Home Valuation Report for This Property
The Home Valuation Report is an in-depth analysis detailing your home's value as well as a comparison with similar homes in the area
Home Values in the Area
Average Home Value in this Area
Purchase History
| Date | Buyer | Sale Price | Title Company |
|---|---|---|---|
| Commonwealth Mtg Lendi | $200,000 | -- | |
| Commonwealth Mtg Lend | $200,000 | -- |
Source: Public Records
Mortgage History
| Date | Status | Borrower | Loan Amount |
|---|---|---|---|
| Previous Owner | Commonwealth Mtg Lend | $280,000 |
Source: Public Records
Tax History Compared to Growth
Tax History
| Year | Tax Paid | Tax Assessment Tax Assessment Total Assessment is a certain percentage of the fair market value that is determined by local assessors to be the total taxable value of land and additions on the property. | Land | Improvement |
|---|---|---|---|---|
| 2025 | $6,940 | $426,000 | $239,600 | $186,400 |
| 2024 | $7,048 | $429,500 | $239,600 | $189,900 |
| 2023 | $6,992 | $415,200 | $234,900 | $180,300 |
| 2022 | $7,677 | $415,200 | $234,900 | $180,300 |
| 2021 | $7,622 | $411,100 | $234,900 | $176,200 |
| 2020 | $8,182 | $446,600 | $234,900 | $211,700 |
| 2019 | $7,814 | $426,300 | $234,900 | $191,400 |
| 2018 | $7,467 | $404,500 | $223,000 | $181,500 |
| 2017 | $3,786 | $404,500 | $223,000 | $181,500 |
| 2016 | $6,161 | $346,700 | $172,700 | $174,000 |
| 2015 | $5,874 | $316,000 | $172,700 | $143,300 |
Source: Public Records
Map
Nearby Homes
- 23 Water St
- 44 South St
- 4203 Peters Farm Way Unit 4203
- 43 Church St
- 19 Treetop Park Unit 19
- 196 -198 Turnpike Rd
- 19 Fisher St
- 9 Shaker Way
- 22 Park St
- 8 Stagecoach Cir Unit 8
- 155 Milk St Unit 5
- 177 E Main St
- 28 Crestview Dr
- 2 Talbot Way Unit 2103
- 2 Talbot Way Unit 2208
- 11101 Peters Farm Way Unit 101
- 4206 Peters Farm Way Unit 206
- 16 Ward Ln
- 5 Peters Farm Way Unit 101
- 5 Peters Farm Way Unit 406