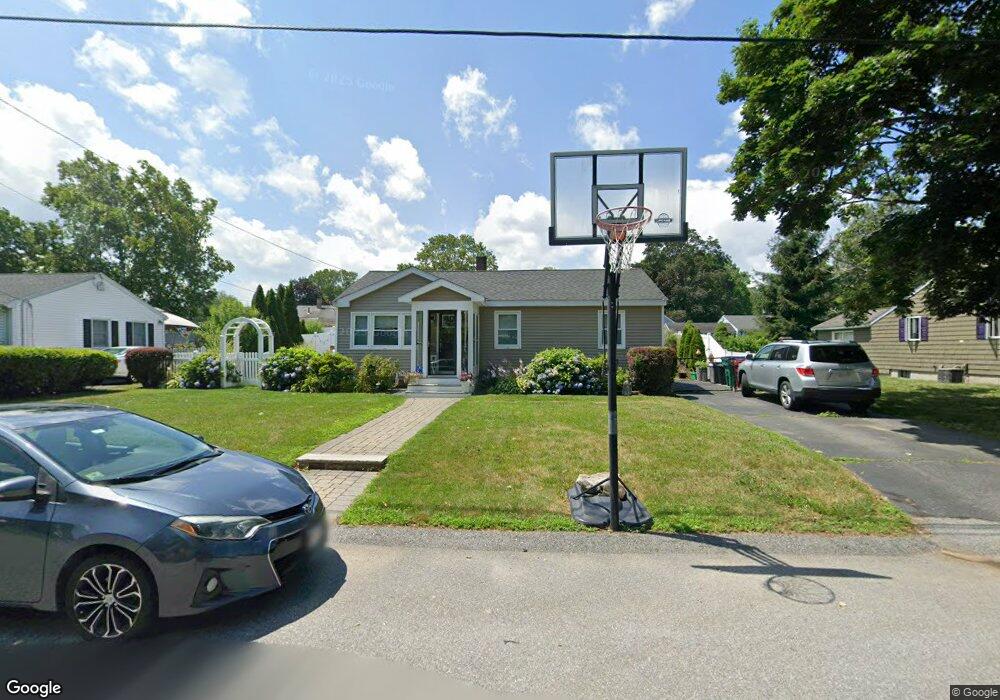
69 Enfield St Lowell, MA 01852
Belvidere NeighborhoodEstimated Value: $544,993 - $583,000
3
Beds
1
Bath
1,166
Sq Ft
$482/Sq Ft
Est. Value
About This Home
This home is located at 69 Enfield St, Lowell, MA 01852 and is currently estimated at $561,998, approximately $481 per square foot. 69 Enfield St is a home located in Middlesex County with nearby schools including Moody Elementary School, Abraham Lincoln Elementary School, and Greenhalge Elementary School.
Ownership History
Date
Name
Owned For
Owner Type
Purchase Details
Closed on
Apr 8, 2002
Sold by
Bulawka Stephen F and Furtado Cynthia A
Bought by
Collins David J and Collins Kimberly M
Current Estimated Value
Home Financials for this Owner
Home Financials are based on the most recent Mortgage that was taken out on this home.
Original Mortgage
$159,750
Interest Rate
6.85%
Mortgage Type
Purchase Money Mortgage
Create a Home Valuation Report for This Property
The Home Valuation Report is an in-depth analysis detailing your home's value as well as a comparison with similar homes in the area
Home Values in the Area
Average Home Value in this Area
Purchase History
| Date | Buyer | Sale Price | Title Company |
|---|---|---|---|
| Collins David J | $177,500 | -- | |
| Collins David J | $177,500 | -- |
Source: Public Records
Mortgage History
| Date | Status | Borrower | Loan Amount |
|---|---|---|---|
| Open | Collins David J | $192,000 | |
| Closed | Collins David J | $161,750 | |
| Closed | Collins David J | $159,750 |
Source: Public Records
Tax History Compared to Growth
Tax History
| Year | Tax Paid | Tax Assessment Tax Assessment Total Assessment is a certain percentage of the fair market value that is determined by local assessors to be the total taxable value of land and additions on the property. | Land | Improvement |
|---|---|---|---|---|
| 2025 | $5,557 | $484,100 | $216,900 | $267,200 |
| 2024 | $5,178 | $434,800 | $195,200 | $239,600 |
| 2023 | $4,920 | $396,100 | $169,800 | $226,300 |
| 2022 | $4,299 | $338,800 | $149,600 | $189,200 |
| 2021 | $4,162 | $309,200 | $130,200 | $179,000 |
| 2020 | $3,870 | $289,700 | $130,200 | $159,500 |
| 2019 | $3,824 | $272,400 | $124,400 | $148,000 |
| 2018 | $3,668 | $254,900 | $118,500 | $136,400 |
| 2017 | $3,538 | $237,100 | $105,300 | $131,800 |
| 2016 | $3,414 | $225,200 | $97,100 | $128,100 |
| 2015 | $3,438 | $222,100 | $97,100 | $125,000 |
| 2013 | $3,328 | $221,700 | $115,300 | $106,400 |
Source: Public Records
Map
Nearby Homes
- 70 Enfield St
- 288 Hovey St
- 4 Glenmere St
- 251 Clark Rd
- 111 Draper St
- 45 Clark Rd
- 45 Luce St
- 26 Luce St
- 18 Whitehead Ave
- 16 Wetherbee Ave
- 97 Hoyt Ave
- 53 Fairmount St
- 11 Merrimack Meadows Ln Unit 17
- 318 Andover St
- 15 Sharyn Cir
- 216 Nesmith St Unit 2
- 44 Hanks St
- 16 Winding Ln
- 112 Fort Hill Ave
- 78 Merrimack Meadows Ln Unit 78