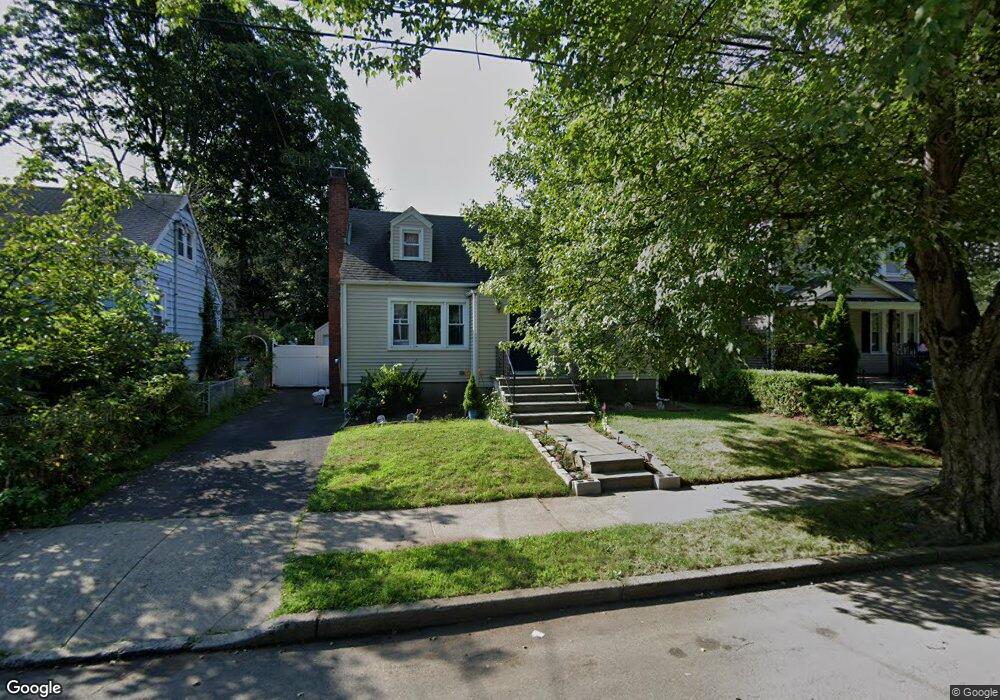
69 Fern St Bridgeport, CT 06606
North End NeighborhoodEstimated Value: $351,000 - $403,000
3
Beds
2
Baths
1,152
Sq Ft
$330/Sq Ft
Est. Value
About This Home
This home is located at 69 Fern St, Bridgeport, CT 06606 and is currently estimated at $380,618, approximately $330 per square foot. 69 Fern St is a home located in Fairfield County with nearby schools including Blackham School, Central High School, and St Andrew School.
Ownership History
Date
Name
Owned For
Owner Type
Purchase Details
Closed on
May 25, 2011
Sold by
Hdf Community Works Ll
Bought by
Garcia Juan
Current Estimated Value
Home Financials for this Owner
Home Financials are based on the most recent Mortgage that was taken out on this home.
Original Mortgage
$83,460
Outstanding Balance
$58,161
Interest Rate
4.94%
Estimated Equity
$322,457
Purchase Details
Closed on
Jan 4, 2010
Sold by
Fnma
Bought by
Hdf Community Works Ll
Purchase Details
Closed on
Aug 27, 1999
Sold by
Fazekas David
Bought by
Calandro Nicholas and Avellanet Xiomara
Purchase Details
Closed on
Jun 11, 1997
Sold by
Buedinger William H and Buedinger Sheelah A
Bought by
Fazekas David A
Purchase Details
Closed on
May 15, 1990
Sold by
Pressman Golda
Bought by
Murphy Sheelah
Create a Home Valuation Report for This Property
The Home Valuation Report is an in-depth analysis detailing your home's value as well as a comparison with similar homes in the area
Home Values in the Area
Average Home Value in this Area
Purchase History
| Date | Buyer | Sale Price | Title Company |
|---|---|---|---|
| Garcia Juan | $155,000 | -- | |
| Garcia Juan | $155,000 | -- | |
| Hdf Community Works Ll | $120,000 | -- | |
| Federal National Mortgage Association | -- | -- | |
| Washington Mutual Bk | -- | -- | |
| Federal National Mortgage Association | -- | -- | |
| Calandro Nicholas | $134,020 | -- | |
| Calandro Nicholas | $134,020 | -- | |
| Fazekas David A | $88,500 | -- | |
| Fazekas David A | $88,500 | -- | |
| Murphy Sheelah | $106,000 | -- |
Source: Public Records
Mortgage History
| Date | Status | Borrower | Loan Amount |
|---|---|---|---|
| Open | Murphy Sheelah | $83,460 | |
| Closed | Murphy Sheelah | $31,000 |
Source: Public Records
Tax History Compared to Growth
Tax History
| Year | Tax Paid | Tax Assessment Tax Assessment Total Assessment is a certain percentage of the fair market value that is determined by local assessors to be the total taxable value of land and additions on the property. | Land | Improvement |
|---|---|---|---|---|
| 2025 | $6,181 | $142,260 | $75,310 | $66,950 |
| 2024 | $6,181 | $142,260 | $75,310 | $66,950 |
| 2023 | $6,181 | $142,260 | $75,310 | $66,950 |
| 2022 | $6,181 | $142,260 | $75,310 | $66,950 |
| 2021 | $6,181 | $142,260 | $75,310 | $66,950 |
| 2020 | $5,430 | $100,570 | $43,270 | $57,300 |
| 2019 | $5,430 | $100,570 | $43,270 | $57,300 |
| 2018 | $5,468 | $100,570 | $43,270 | $57,300 |
| 2017 | $5,468 | $100,570 | $43,270 | $57,300 |
| 2016 | $5,468 | $100,570 | $43,270 | $57,300 |
| 2015 | $5,227 | $123,860 | $49,980 | $73,880 |
| 2014 | $5,227 | $123,860 | $49,980 | $73,880 |
Source: Public Records
Map
Nearby Homes
- 184 Merritt St
- 214 Burnsford Ave
- 260 Birmingham St
- 113 Clark St
- 1095 Wayne St
- 3401 Main St
- 339 Goldenrod Ave
- 354 Beechmont Ave
- 375 Ruth St
- 215 Overland Ave
- 245 Glendale Ave Unit D8
- 25 Broadway
- 604 Birmingham St
- 234 Savoy St
- 45 Stevens St Unit 2
- 38 Enid St Unit B
- 814 Platt St
- 376 Savoy St
- 200 Woodmont Ave Unit 100
- 495 Peet St
- 59 Fern St
- 79 Fern St
- 49 Fern St
- 78 Burnsford Ave
- 68 Fern St
- 40 Burnsford Ave Unit 2nd
- 50 Burnsford Ave
- 40 Burnsford Ave Unit 1
- 52 Burnsford Ave
- 52 Burnsford Ave Unit B
- 99 Fern St
- 62 Burnsford Ave Unit 64
- 42 Fern St
- 102 Burnsford Ave
- 42 Burnsford Ave
- 42 Burnsford Ave Unit 2nd
- 100 Burnsford Ave
- 109 Fern St
- 29 Fern St