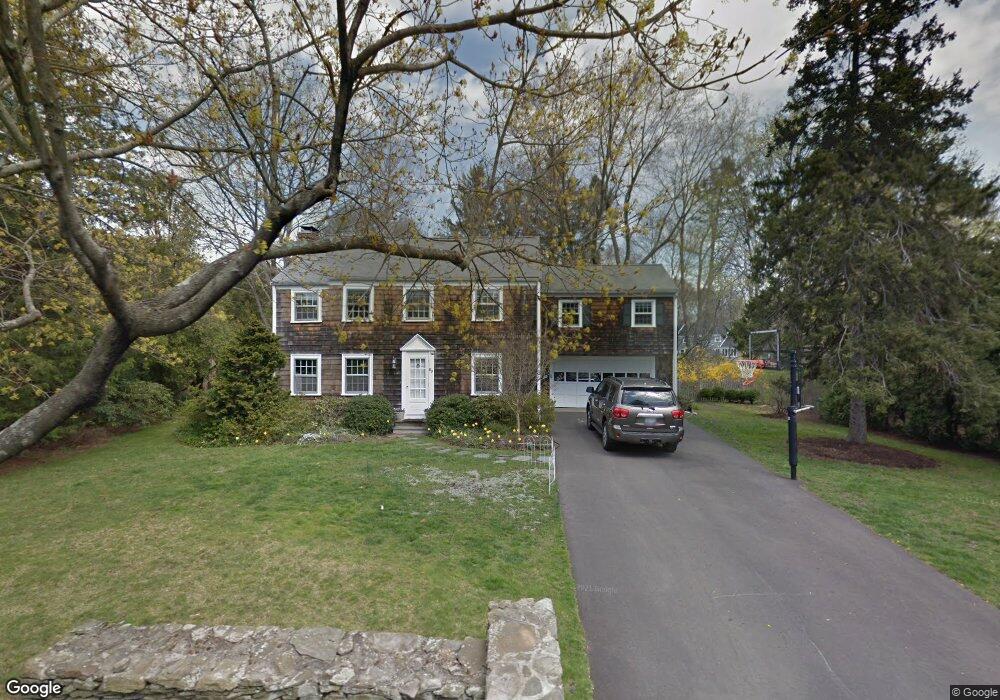
69 Ferry Ln Barrington, RI 02806
Rumstick NeighborhoodEstimated Value: $1,015,292 - $1,303,000
4
Beds
3
Baths
2,240
Sq Ft
$524/Sq Ft
Est. Value
About This Home
This home is located at 69 Ferry Ln, Barrington, RI 02806 and is currently estimated at $1,174,323, approximately $524 per square foot. 69 Ferry Ln is a home located in Bristol County with nearby schools including Barrington High School, Barrington Christian Academy, and St. Andrews School.
Ownership History
Date
Name
Owned For
Owner Type
Purchase Details
Closed on
Dec 9, 2022
Sold by
Loew Matthew J and Loew Elizabeth H
Bought by
Elizabeth H Loew T
Current Estimated Value
Purchase Details
Closed on
Jul 1, 2002
Sold by
Chitouras George J and Chitouras Elizabeth A
Bought by
Loew Matthew J and Loew Elizabeth H
Purchase Details
Closed on
Oct 31, 2000
Sold by
Keeney Lorraine T
Bought by
Chitouras George J and Chitouras Elizabeth
Create a Home Valuation Report for This Property
The Home Valuation Report is an in-depth analysis detailing your home's value as well as a comparison with similar homes in the area
Home Values in the Area
Average Home Value in this Area
Purchase History
| Date | Buyer | Sale Price | Title Company |
|---|---|---|---|
| Elizabeth H Loew T | -- | None Available | |
| Loew Matthew J | $465,000 | -- | |
| Chitouras George J | $370,000 | -- |
Source: Public Records
Mortgage History
| Date | Status | Borrower | Loan Amount |
|---|---|---|---|
| Previous Owner | Chitouras George J | $356,500 | |
| Previous Owner | Chitouras George J | $385,000 | |
| Previous Owner | Chitouras George J | $420,000 |
Source: Public Records
Tax History
| Year | Tax Paid | Tax Assessment Tax Assessment Total Assessment is a certain percentage of the fair market value that is determined by local assessors to be the total taxable value of land and additions on the property. | Land | Improvement |
|---|---|---|---|---|
| 2025 | $13,821 | $901,000 | $543,000 | $358,000 |
| 2024 | $13,290 | $901,000 | $543,000 | $358,000 |
| 2023 | $13,114 | $646,000 | $362,000 | $284,000 |
| 2022 | $12,694 | $646,000 | $362,000 | $284,000 |
| 2021 | $12,371 | $646,000 | $362,000 | $284,000 |
| 2020 | $12,289 | $588,000 | $325,000 | $263,000 |
| 2019 | $11,819 | $588,000 | $325,000 | $263,000 |
| 2018 | $11,466 | $588,000 | $325,000 | $263,000 |
| 2017 | $11,668 | $583,400 | $324,600 | $258,800 |
| 2016 | $10,764 | $583,400 | $324,600 | $258,800 |
| 2015 | $10,647 | $583,400 | $324,600 | $258,800 |
| 2014 | $9,287 | $507,500 | $265,800 | $241,700 |
Source: Public Records
Map
Nearby Homes
- 59 Ferry Ln
- 22 Lantern Ln
- 51 Hawthorne Ave
- 74 Adams Point Rd
- 11 Mathewson Rd
- 10 Jesse Davis Ln
- 37 Warren Ave
- 31 Child St
- 13 Kelly St
- 21 Federal St
- 69 Cutler St
- 115 Market St
- 9 Lillis Ave
- 0 Lillis Ave
- 39 Bagy Wrinkle Cove
- 35 Bagy Wrinkle Cove
- 2 Bagy Wrinkle Cove
- 388 Child St
- 210 Metacom Ave
- 20 Burr Ave
Your Personal Tour Guide
Ask me questions while you tour the home.