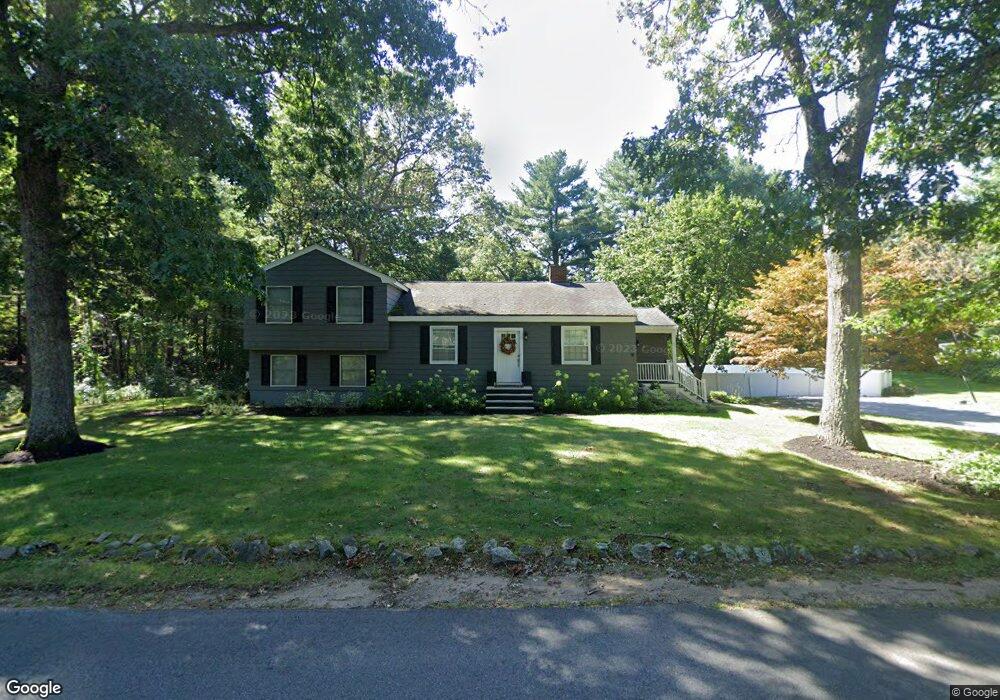
69 Gould Rd Andover, MA 01810
Estimated Value: $981,000 - $1,038,332
4
Beds
3
Baths
2,735
Sq Ft
$370/Sq Ft
Est. Value
About This Home
This home is located at 69 Gould Rd, Andover, MA 01810 and is currently estimated at $1,012,333, approximately $370 per square foot. 69 Gould Rd is a home located in Essex County with nearby schools including South Elementary School, Doherty Middle School, and Andover High School.
Ownership History
Date
Name
Owned For
Owner Type
Purchase Details
Closed on
Jun 2, 2011
Sold by
Gagne Gregory C and Gagne Maria L
Bought by
Belscher Stephen H and Belscher Kerri A
Current Estimated Value
Home Financials for this Owner
Home Financials are based on the most recent Mortgage that was taken out on this home.
Original Mortgage
$482,451
Outstanding Balance
$332,436
Interest Rate
4.62%
Mortgage Type
FHA
Estimated Equity
$679,897
Create a Home Valuation Report for This Property
The Home Valuation Report is an in-depth analysis detailing your home's value as well as a comparison with similar homes in the area
Home Values in the Area
Average Home Value in this Area
Purchase History
| Date | Buyer | Sale Price | Title Company |
|---|---|---|---|
| Belscher Stephen H | $495,000 | -- |
Source: Public Records
Mortgage History
| Date | Status | Borrower | Loan Amount |
|---|---|---|---|
| Open | Belscher Stephen H | $482,451 |
Source: Public Records
Tax History Compared to Growth
Tax History
| Year | Tax Paid | Tax Assessment Tax Assessment Total Assessment is a certain percentage of the fair market value that is determined by local assessors to be the total taxable value of land and additions on the property. | Land | Improvement |
|---|---|---|---|---|
| 2024 | $10,886 | $845,200 | $510,300 | $334,900 |
| 2023 | $10,417 | $762,600 | $459,800 | $302,800 |
| 2022 | $9,575 | $655,800 | $400,100 | $255,700 |
| 2021 | $9,168 | $599,600 | $364,000 | $235,600 |
| 2020 | $8,799 | $586,200 | $355,300 | $230,900 |
| 2019 | $8,570 | $561,200 | $344,800 | $216,400 |
| 2018 | $8,313 | $531,500 | $331,700 | $199,800 |
| 2017 | $7,948 | $523,600 | $325,200 | $198,400 |
| 2016 | $7,763 | $523,800 | $325,200 | $198,600 |
| 2015 | $7,492 | $500,500 | $312,600 | $187,900 |
Source: Public Records
Map
Nearby Homes
- 20 Colonial Dr Unit 3
- 30A Colonial Dr Unit 6
- 1 Colonial Dr Unit C1-6
- B1 Colonial Dr Unit 8
- 497 S Main St
- 5 Mohawk Rd
- 18 Boston Rd
- 21 Rocky Hill Rd
- 14 Pine Ridge Rd
- 10 Voke St
- 2 Clover Cir
- 2 Glenwood Rd
- 198 Jenkins Rd
- 6 Westward Cir
- 11 Sullivan Rd
- 1 Country Club Rd
- 12 Parkview Terrace
- 23 Pomeroy Rd
- 7 Countryside Way
- 7 Greenbriar Dr Unit 202