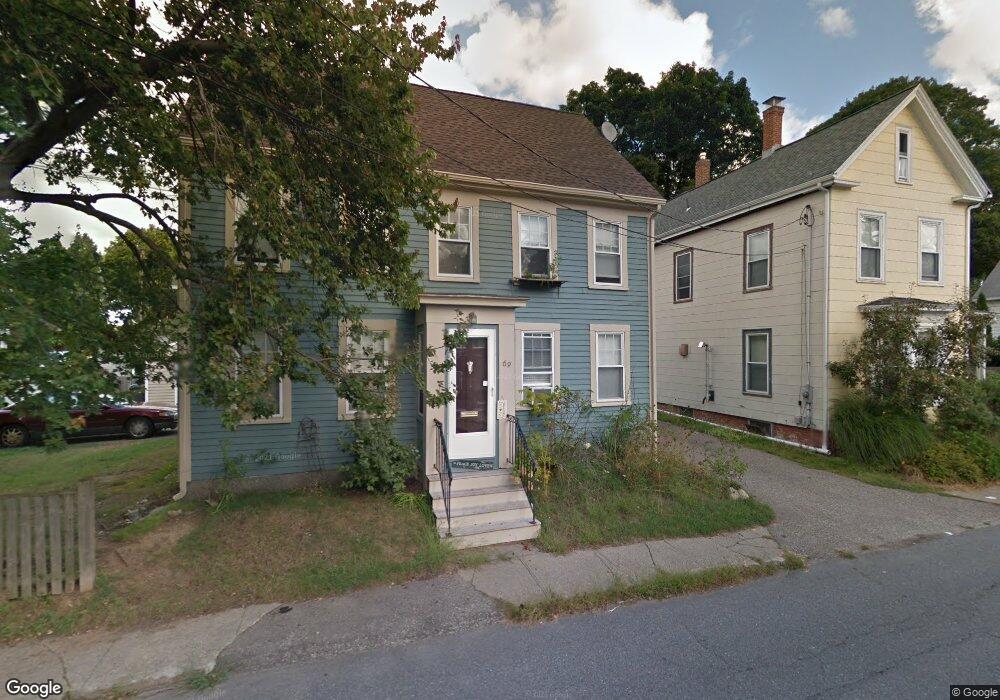
69 High St Amesbury, MA 01913
Estimated Value: $511,000 - $684,843
4
Beds
2
Baths
1,892
Sq Ft
$311/Sq Ft
Est. Value
About This Home
This home is located at 69 High St, Amesbury, MA 01913 and is currently estimated at $588,461, approximately $311 per square foot. 69 High St is a home located in Essex County with nearby schools including Amesbury High School and Amesbury Seventh-Day Adventist School.
Ownership History
Date
Name
Owned For
Owner Type
Purchase Details
Closed on
May 2, 2016
Sold by
Carrier Pauline A and Carrier Angela N
Bought by
Manny 1 Realty Llc
Current Estimated Value
Home Financials for this Owner
Home Financials are based on the most recent Mortgage that was taken out on this home.
Original Mortgage
$197,000
Outstanding Balance
$157,182
Interest Rate
3.73%
Mortgage Type
Commercial
Estimated Equity
$431,279
Purchase Details
Closed on
Jun 6, 2003
Sold by
Carrier Melissa D and Carrier Pauline A
Bought by
Carrier Pauline A and Carrier Angela N
Home Financials for this Owner
Home Financials are based on the most recent Mortgage that was taken out on this home.
Original Mortgage
$187,000
Interest Rate
5.83%
Mortgage Type
Purchase Money Mortgage
Create a Home Valuation Report for This Property
The Home Valuation Report is an in-depth analysis detailing your home's value as well as a comparison with similar homes in the area
Home Values in the Area
Average Home Value in this Area
Purchase History
| Date | Buyer | Sale Price | Title Company |
|---|---|---|---|
| Manny 1 Realty Llc | $220,000 | -- | |
| Carrier Pauline A | $73,000 | -- |
Source: Public Records
Mortgage History
| Date | Status | Borrower | Loan Amount |
|---|---|---|---|
| Open | Manny 1 Realty Llc | $197,000 | |
| Previous Owner | Carrier Pauline A | $187,000 | |
| Previous Owner | Carrier Pauline A | $60,000 |
Source: Public Records
Tax History Compared to Growth
Tax History
| Year | Tax Paid | Tax Assessment Tax Assessment Total Assessment is a certain percentage of the fair market value that is determined by local assessors to be the total taxable value of land and additions on the property. | Land | Improvement |
|---|---|---|---|---|
| 2025 | $7,199 | $470,500 | $190,400 | $280,100 |
| 2024 | $7,094 | $453,600 | $179,600 | $274,000 |
| 2023 | $7,029 | $430,200 | $156,200 | $274,000 |
| 2022 | $6,232 | $352,300 | $135,800 | $216,500 |
| 2021 | $6,605 | $361,900 | $104,900 | $257,000 |
| 2020 | $5,908 | $343,900 | $100,900 | $243,000 |
| 2019 | $5,059 | $275,400 | $100,900 | $174,500 |
| 2018 | $4,673 | $246,100 | $96,100 | $150,000 |
| 2017 | $4,700 | $235,600 | $96,100 | $139,500 |
| 2016 | $4,600 | $226,800 | $96,100 | $130,700 |
| 2015 | $4,658 | $226,800 | $96,100 | $130,700 |
| 2014 | $4,756 | $226,800 | $96,100 | $130,700 |
Source: Public Records
Map
Nearby Homes
- 81 High St Unit 27
- 37 Millyard Unit 204
- 48 Orchard St
- 19 Perkins St
- 53 Market St
- 129 Friend St
- 13 Lincoln Ct
- 17 Lincoln Ct
- 15 Sparhawk St Unit 3
- 24 Aubin St Unit 2
- 101 Market St Unit B
- 101 Market St Unit A
- 43 Aubin St Unit 1
- 103 Market St Unit A
- 103 Market St Unit B
- 105 Market St Unit B
- 5 Richs Ct Unit 3
- 25 Cedar St Unit 4
- 25 Cedar St Unit 7
- 97 Elm St