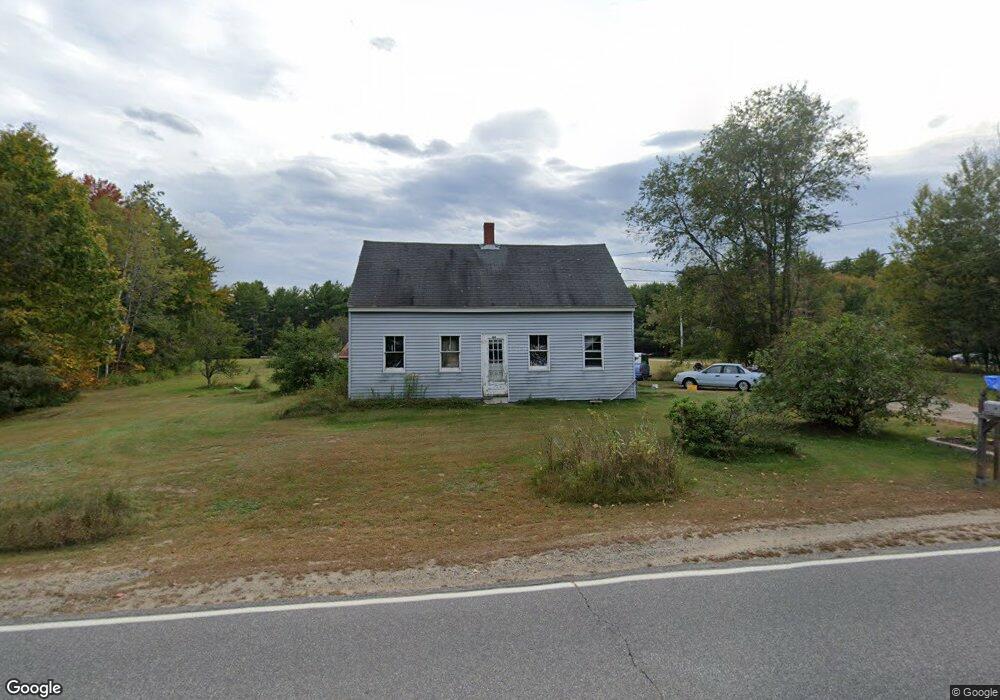
69 Hubbard Rd Berwick, ME 03901
Estimated Value: $503,000 - $731,774
Studio
3
Baths
--
Sq Ft
387,684
Sq Ft Lot
About This Home
This home is located at 69 Hubbard Rd, Berwick, ME 03901 and is currently estimated at $635,694. 69 Hubbard Rd is a home located in York County with nearby schools including Noble High School and Tri-City Christian Academy.
Create a Home Valuation Report for This Property
The Home Valuation Report is an in-depth analysis detailing your home's value as well as a comparison with similar homes in the area
Home Values in the Area
Average Home Value in this Area
Tax History
| Year | Tax Paid | Tax Assessment Tax Assessment Total Assessment is a certain percentage of the fair market value that is determined by local assessors to be the total taxable value of land and additions on the property. | Land | Improvement |
|---|---|---|---|---|
| 2025 | $7,754 | $594,600 | $163,400 | $431,200 |
| 2024 | $7,415 | $594,600 | $163,400 | $431,200 |
| 2023 | $6,714 | $366,500 | $112,000 | $254,500 |
| 2022 | $6,678 | $366,500 | $112,000 | $254,500 |
| 2021 | $6,791 | $371,100 | $112,000 | $259,100 |
| 2020 | $7,184 | $371,100 | $112,000 | $259,100 |
| 2019 | $6,505 | $371,100 | $112,000 | $259,100 |
| 2018 | $5,921 | $336,400 | $93,800 | $242,600 |
| 2017 | $5,769 | $336,400 | $93,800 | $242,600 |
| 2016 | $5,480 | $336,200 | $93,800 | $242,400 |
| 2014 | $5,346 | $336,200 | $93,800 | $242,400 |
| 2013 | $5,396 | $336,200 | $93,800 | $242,400 |
Source: Public Records
Map
Nearby Homes
Your Personal Tour Guide
Ask me questions while you tour the home.