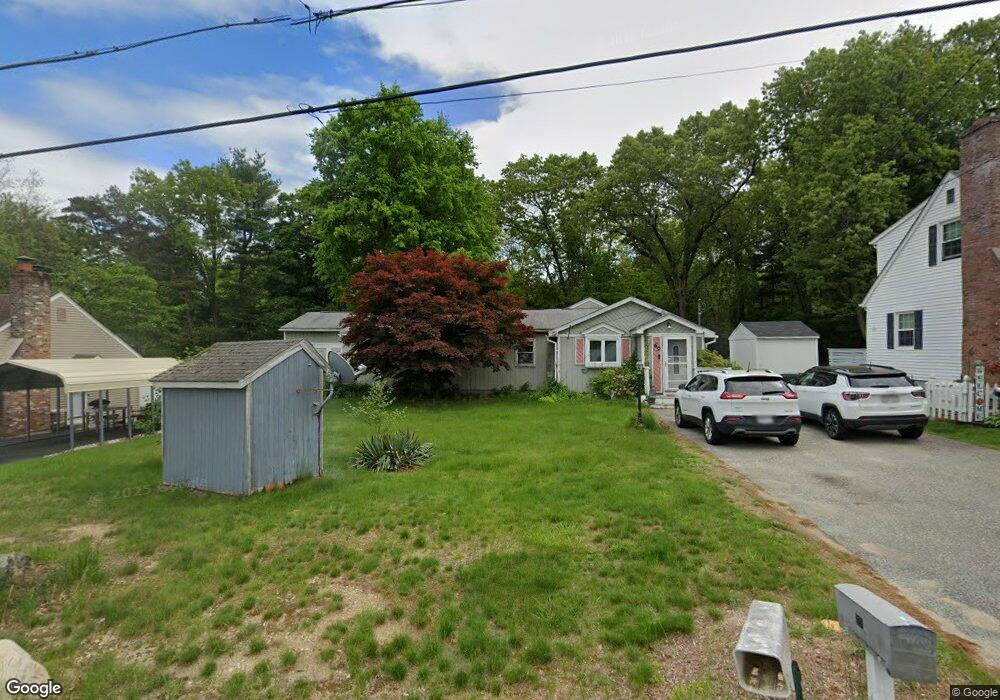
69 Jennings St Springfield, MA 01119
Pine Point NeighborhoodEstimated Value: $196,000 - $401,000
4
Beds
1
Bath
1,855
Sq Ft
$158/Sq Ft
Est. Value
About This Home
This home is located at 69 Jennings St, Springfield, MA 01119 and is currently estimated at $292,563, approximately $157 per square foot. 69 Jennings St is a home located in Hampden County with nearby schools including Thomas M Balliet Elementary School, John J Duggan Middle, and Springfield Central High School.
Ownership History
Date
Name
Owned For
Owner Type
Purchase Details
Closed on
Nov 20, 1998
Sold by
Booth David J and Booth Beth E
Bought by
Goodman Roy
Current Estimated Value
Home Financials for this Owner
Home Financials are based on the most recent Mortgage that was taken out on this home.
Original Mortgage
$71,930
Outstanding Balance
$15,563
Interest Rate
6.49%
Mortgage Type
Purchase Money Mortgage
Estimated Equity
$277,000
Create a Home Valuation Report for This Property
The Home Valuation Report is an in-depth analysis detailing your home's value as well as a comparison with similar homes in the area
Home Values in the Area
Average Home Value in this Area
Purchase History
| Date | Buyer | Sale Price | Title Company |
|---|---|---|---|
| Goodman Roy | $71,500 | -- |
Source: Public Records
Mortgage History
| Date | Status | Borrower | Loan Amount |
|---|---|---|---|
| Open | Goodman Roy | $71,930 | |
| Previous Owner | Goodman Roy | $50,000 | |
| Previous Owner | Goodman Roy | $25,000 | |
| Previous Owner | Goodman Roy | $25,000 |
Source: Public Records
Tax History
| Year | Tax Paid | Tax Assessment Tax Assessment Total Assessment is a certain percentage of the fair market value that is determined by local assessors to be the total taxable value of land and additions on the property. | Land | Improvement |
|---|---|---|---|---|
| 2025 | $3,075 | $196,100 | $38,900 | $157,200 |
| 2024 | $3,177 | $197,800 | $38,900 | $158,900 |
| 2023 | $2,559 | $150,100 | $34,400 | $115,700 |
| 2022 | $2,492 | $132,400 | $32,200 | $100,200 |
| 2021 | $3,081 | $163,000 | $29,300 | $133,700 |
| 2020 | $2,744 | $140,500 | $29,300 | $111,200 |
| 2019 | $2,667 | $135,500 | $30,300 | $105,200 |
| 2018 | $2,539 | $129,000 | $30,300 | $98,700 |
| 2017 | $2,440 | $124,100 | $33,300 | $90,800 |
| 2016 | $2,349 | $119,500 | $33,300 | $86,200 |
| 2015 | $2,435 | $123,800 | $33,300 | $90,500 |
Source: Public Records
Map
Nearby Homes
- 79 Jennings St
- 63 Jennings St
- 90 Jennings St
- 80 Jennings St
- 115 Jennings St
- 70 Jennings St
- 65 Woodrow St
- 50 Jennings St
- 45 Jennings St
- 73 Woodrow St
- 81 Woodrow St
- 89 Woodrow St Unit 91
- 93 Woodrow St Unit 95
- 47 Woodrow St
- 44 Jennings St
- 72 Woodrow St
- 76 Woodrow St Unit 78
- 76-78 Woodrow St
- 64 Woodrow St Unit 66
- 64 Woodrow St Unit 1
Your Personal Tour Guide
Ask me questions while you tour the home.