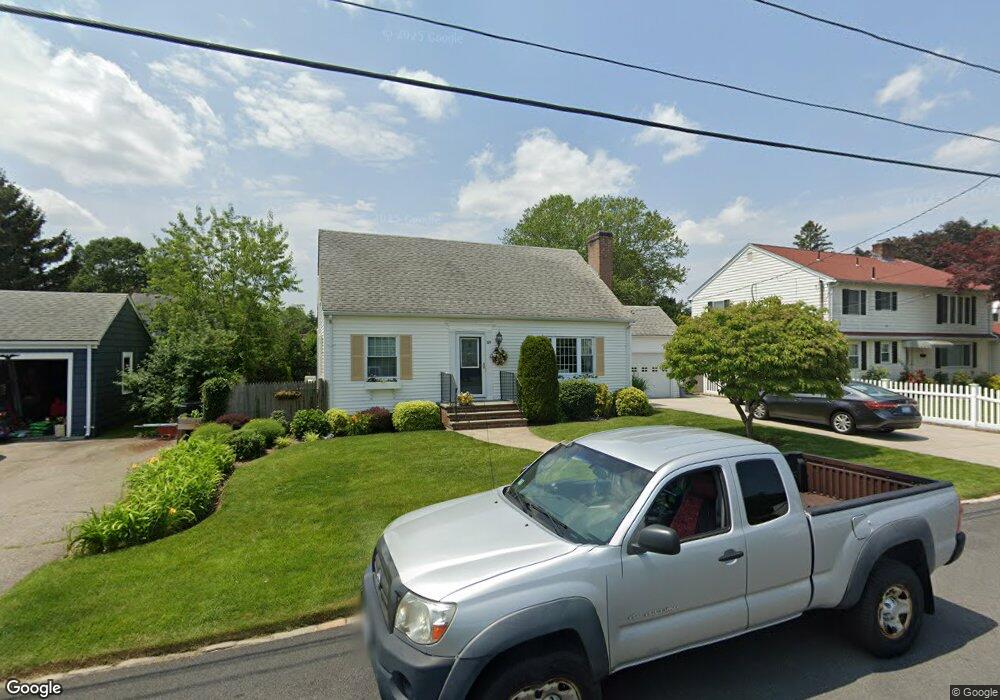
69 Kenyon Rd Cranston, RI 02910
Eden Park NeighborhoodEstimated Value: $435,110 - $472,000
3
Beds
3
Baths
1,473
Sq Ft
$310/Sq Ft
Est. Value
About This Home
This home is located at 69 Kenyon Rd, Cranston, RI 02910 and is currently estimated at $456,028, approximately $309 per square foot. 69 Kenyon Rd is a home located in Providence County with nearby schools including Park View Middle School, Cranston High School East, and Cadence Academy Preschool - Cranston.
Ownership History
Date
Name
Owned For
Owner Type
Purchase Details
Closed on
Apr 17, 2017
Sold by
Armstrong Norman R and Armstrong Kathryn H
Bought by
N & K Armstrong 2017 Irt
Current Estimated Value
Create a Home Valuation Report for This Property
The Home Valuation Report is an in-depth analysis detailing your home's value as well as a comparison with similar homes in the area
Home Values in the Area
Average Home Value in this Area
Purchase History
| Date | Buyer | Sale Price | Title Company |
|---|---|---|---|
| N & K Armstrong 2017 Irt | -- | -- |
Source: Public Records
Mortgage History
| Date | Status | Borrower | Loan Amount |
|---|---|---|---|
| Previous Owner | N & K Armstrong 2017 Irt | $60,000 | |
| Previous Owner | N & K Armstrong 2017 Irt | $40,000 | |
| Previous Owner | N & K Armstrong 2017 Irt | $75,000 | |
| Previous Owner | N & K Armstrong 2017 Irt | $30,000 |
Source: Public Records
Tax History
| Year | Tax Paid | Tax Assessment Tax Assessment Total Assessment is a certain percentage of the fair market value that is determined by local assessors to be the total taxable value of land and additions on the property. | Land | Improvement |
|---|---|---|---|---|
| 2025 | $5,079 | $365,900 | $109,400 | $256,500 |
| 2024 | $4,893 | $359,500 | $109,400 | $250,100 |
| 2023 | $4,608 | $243,800 | $72,000 | $171,800 |
| 2022 | $4,513 | $243,800 | $72,000 | $171,800 |
| 2021 | $4,388 | $243,800 | $72,000 | $171,800 |
| 2020 | $4,187 | $201,600 | $68,600 | $133,000 |
| 2019 | $4,187 | $201,600 | $68,600 | $133,000 |
| 2018 | $4,090 | $201,600 | $68,600 | $133,000 |
| 2017 | $4,157 | $181,200 | $61,800 | $119,400 |
| 2016 | $4,068 | $181,200 | $61,800 | $119,400 |
| 2015 | $4,068 | $181,200 | $61,800 | $119,400 |
| 2014 | $3,981 | $174,300 | $61,800 | $112,500 |
Source: Public Records
Map
Nearby Homes
Your Personal Tour Guide
Ask me questions while you tour the home.