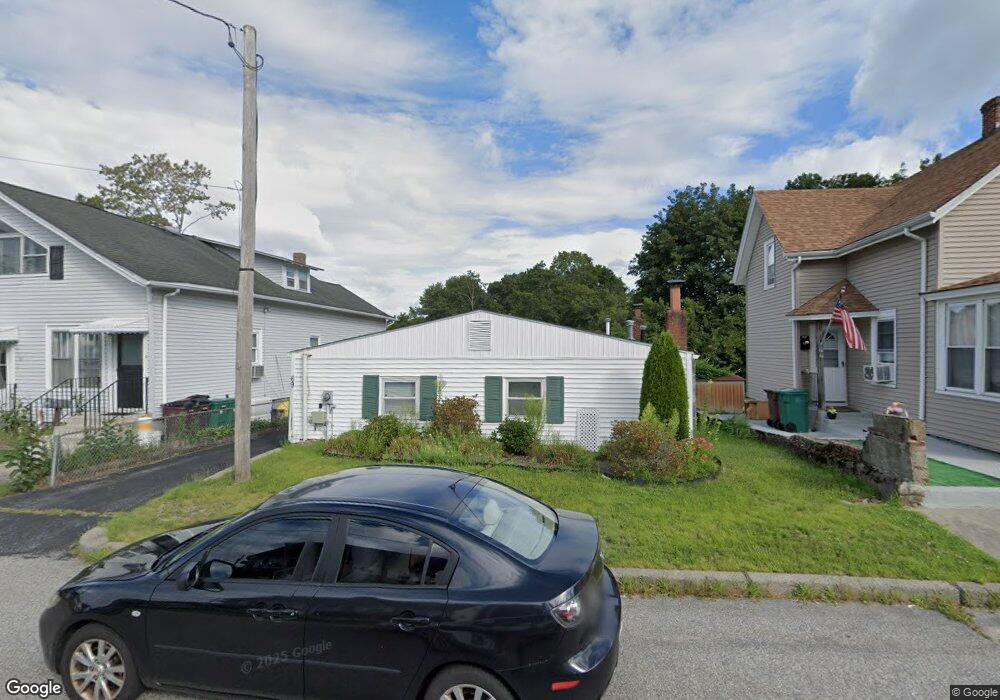
69 Le Brun Ave Woonsocket, RI 02895
East Woonsocket NeighborhoodEstimated Value: $328,004 - $372,000
3
Beds
1
Bath
1,260
Sq Ft
$277/Sq Ft
Est. Value
About This Home
This home is located at 69 Le Brun Ave, Woonsocket, RI 02895 and is currently estimated at $348,751, approximately $276 per square foot. 69 Le Brun Ave is a home located in Providence County with nearby schools including Woonsocket High School and Good Shepherd Catholic School.
Ownership History
Date
Name
Owned For
Owner Type
Purchase Details
Closed on
Apr 28, 2004
Sold by
Merolla Raymond N
Bought by
Farnsworth Richard R
Current Estimated Value
Create a Home Valuation Report for This Property
The Home Valuation Report is an in-depth analysis detailing your home's value as well as a comparison with similar homes in the area
Home Values in the Area
Average Home Value in this Area
Purchase History
| Date | Buyer | Sale Price | Title Company |
|---|---|---|---|
| Farnsworth Richard R | $15,000 | -- | |
| Farnsworth Richard R | $15,000 | -- |
Source: Public Records
Mortgage History
| Date | Status | Borrower | Loan Amount |
|---|---|---|---|
| Closed | Farnsworth Richard R | $124,200 | |
| Closed | Farnsworth Richard R | $10,000 |
Source: Public Records
Tax History
| Year | Tax Paid | Tax Assessment Tax Assessment Total Assessment is a certain percentage of the fair market value that is determined by local assessors to be the total taxable value of land and additions on the property. | Land | Improvement |
|---|---|---|---|---|
| 2025 | $3,053 | $271,900 | $101,400 | $170,500 |
| 2024 | $2,694 | $185,300 | $89,900 | $95,400 |
| 2023 | $2,590 | $185,300 | $89,900 | $95,400 |
| 2022 | $2,590 | $185,300 | $89,900 | $95,400 |
| 2021 | $2,793 | $117,600 | $55,000 | $62,600 |
| 2020 | $2,822 | $117,600 | $55,000 | $62,600 |
| 2018 | $2,832 | $117,600 | $55,000 | $62,600 |
| 2017 | $2,763 | $91,800 | $44,200 | $47,600 |
| 2016 | $2,923 | $91,800 | $44,200 | $47,600 |
| 2015 | $3,358 | $91,800 | $44,200 | $47,600 |
| 2014 | $3,339 | $92,900 | $48,600 | $44,300 |
Source: Public Records
Map
Nearby Homes
- 23 Rutland St
- 568 Elm St
- 34 Heroux Ave
- 56 Mailloux St
- 311 Elm St
- 271 Elm St
- 263 Elm St
- 68 Kenwood St
- 95 Mitris Blvd
- 110 Saint Leon Ave
- 375 Congress St
- 212 Saint Louis Ave
- 142 Brook St
- 685 Social St Unit 211
- 685 Social St Unit 115
- 188 Saint Louis Ave
- 178 Saint Louis Ave
- 752 Social St
- 727 Mendon Rd
- 88 Mill St Unit 304
Your Personal Tour Guide
Ask me questions while you tour the home.