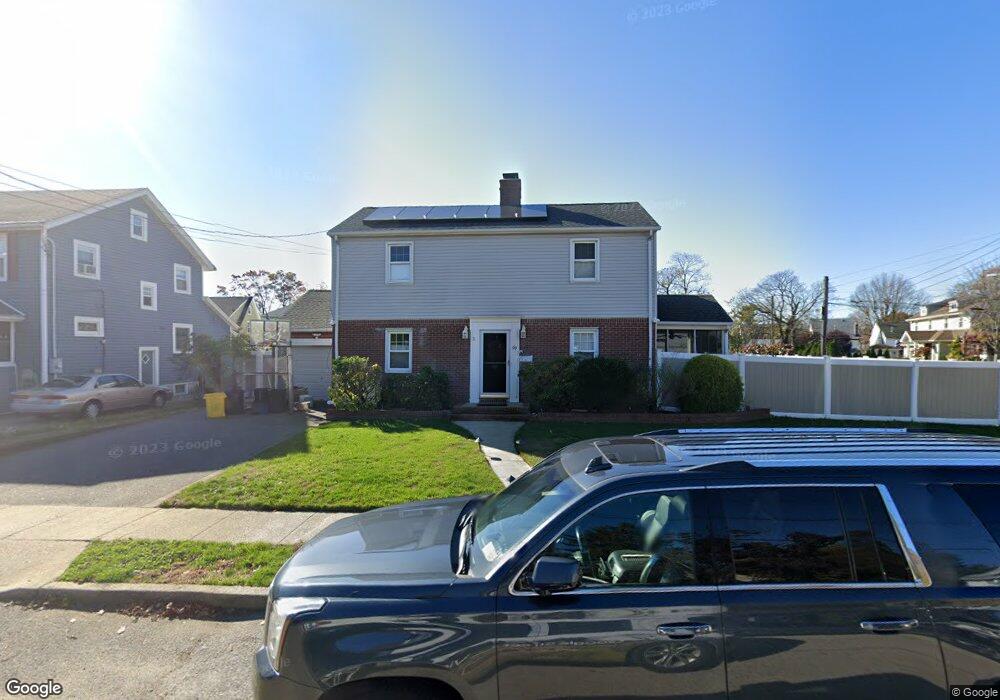
69 Lloyd Ave Lynbrook, NY 11563
Estimated Value: $742,515 - $817,000
3
Beds
2
Baths
1,320
Sq Ft
$591/Sq Ft
Est. Value
About This Home
This home is located at 69 Lloyd Ave, Lynbrook, NY 11563 and is currently estimated at $779,758, approximately $590 per square foot. 69 Lloyd Ave is a home located in Nassau County with nearby schools including Lynbrook Senior High School and Our Lady Of Peace School.
Ownership History
Date
Name
Owned For
Owner Type
Purchase Details
Closed on
Nov 2, 2017
Sold by
Sarro Marie Rinaldi
Bought by
Zols William and Zols Marie Anne
Current Estimated Value
Home Financials for this Owner
Home Financials are based on the most recent Mortgage that was taken out on this home.
Original Mortgage
$424,000
Outstanding Balance
$353,593
Interest Rate
3.85%
Mortgage Type
New Conventional
Estimated Equity
$426,165
Purchase Details
Closed on
Dec 23, 2013
Sold by
Mongiovi Marie
Bought by
Rinaldi Sarro Marie
Home Financials for this Owner
Home Financials are based on the most recent Mortgage that was taken out on this home.
Original Mortgage
$525,000
Interest Rate
4.24%
Mortgage Type
Unknown
Purchase Details
Closed on
Sep 9, 2009
Sold by
Rinaldi-Sarro Marie and Rinaldi John
Bought by
Rinaldi-Sarro Marie and Rinaldi Donna
Create a Home Valuation Report for This Property
The Home Valuation Report is an in-depth analysis detailing your home's value as well as a comparison with similar homes in the area
Home Values in the Area
Average Home Value in this Area
Purchase History
| Date | Buyer | Sale Price | Title Company |
|---|---|---|---|
| Zols William | $535,000 | -- | |
| Rinaldi Sarro Marie | -- | -- | |
| Rinaldi-Sarro Marie | -- | -- |
Source: Public Records
Mortgage History
| Date | Status | Borrower | Loan Amount |
|---|---|---|---|
| Open | Zols William | $424,000 | |
| Previous Owner | Rinaldi Sarro Marie | $525,000 | |
| Previous Owner | Rinaldi Sarro Marie | $525,000 |
Source: Public Records
Tax History Compared to Growth
Tax History
| Year | Tax Paid | Tax Assessment Tax Assessment Total Assessment is a certain percentage of the fair market value that is determined by local assessors to be the total taxable value of land and additions on the property. | Land | Improvement |
|---|---|---|---|---|
| 2025 | $13,302 | $459 | $227 | $232 |
| 2024 | $3,824 | $493 | $244 | $249 |
| 2023 | $13,329 | $507 | $251 | $256 |
| 2022 | $13,329 | $537 | $266 | $271 |
| 2021 | $19,287 | $531 | $263 | $268 |
| 2020 | $14,234 | $708 | $512 | $196 |
| 2019 | $4,164 | $824 | $596 | $228 |
| 2018 | $10,517 | $824 | $0 | $0 |
| 2017 | $7,794 | $824 | $596 | $228 |
| 2016 | $11,546 | $824 | $596 | $228 |
| 2015 | $3,500 | $824 | $596 | $228 |
| 2014 | $3,500 | $824 | $596 | $228 |
| 2013 | $3,418 | $824 | $596 | $228 |
Source: Public Records
Map
Nearby Homes
- 11 Duryea Place
- 33 Starks Place
- 63 Lenox Ave
- 596 Broadway Unit 14B
- 596 Broadway Unit 16B
- 16 Maiden Ln
- 16 Farnum St
- 316 Scranton Ave
- 33 Farnum St
- 33 Prospect Ave
- 366 Peninsula Blvd
- 230 Broadway
- 1 Lewis Place
- 85 Oakland Ave
- 165 Westminster Rd
- 221 Somerset Dr
- 181 Tottenham Rd
- 82 Cherry Ln
- 1608 Union Ave
- 12 Roxy Place