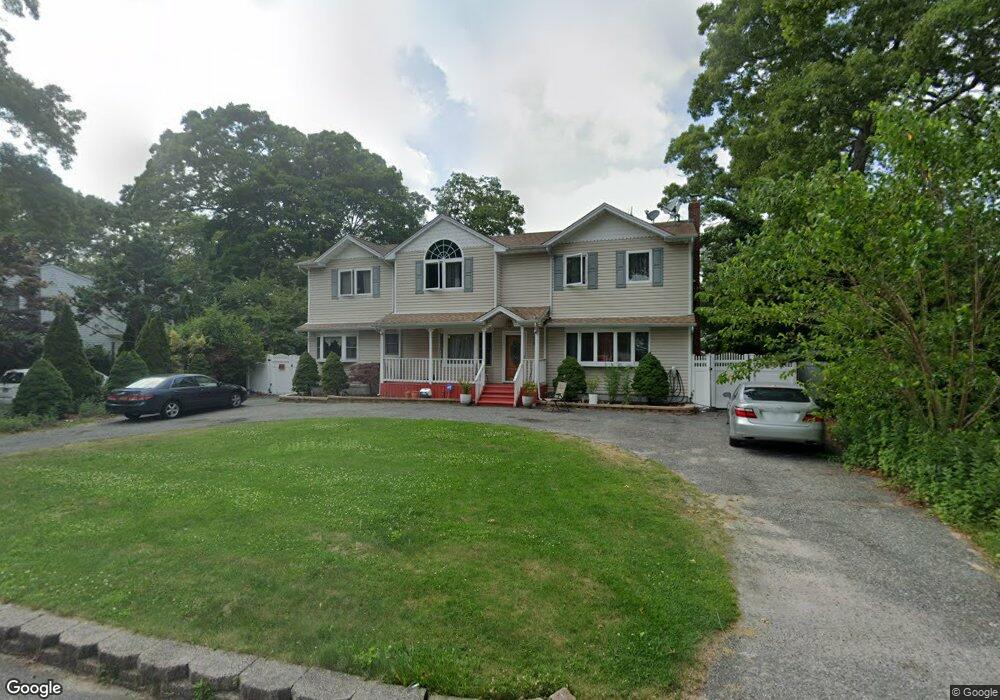
69 Lyman Ave Patchogue, NY 11772
Estimated Value: $672,000 - $953,000
5
Beds
4
Baths
3,040
Sq Ft
$277/Sq Ft
Est. Value
About This Home
This home is located at 69 Lyman Ave, Patchogue, NY 11772 and is currently estimated at $840,681, approximately $276 per square foot. 69 Lyman Ave is a home located in Suffolk County with nearby schools including Patchogue-Medford High School and Holy Angels Regional School.
Ownership History
Date
Name
Owned For
Owner Type
Purchase Details
Closed on
Dec 17, 2012
Sold by
Flanagan John J and Flanagan Jacqueline A
Bought by
Misir Muneshwar and Misir Amalia
Current Estimated Value
Home Financials for this Owner
Home Financials are based on the most recent Mortgage that was taken out on this home.
Original Mortgage
$407,483
Outstanding Balance
$282,053
Interest Rate
3.35%
Mortgage Type
New Conventional
Estimated Equity
$558,628
Purchase Details
Closed on
Sep 11, 2000
Sold by
Flanagan John J and Flanagan Jacqueline A
Bought by
Flanagan John J and Flanagan Jacqueline A
Create a Home Valuation Report for This Property
The Home Valuation Report is an in-depth analysis detailing your home's value as well as a comparison with similar homes in the area
Home Values in the Area
Average Home Value in this Area
Purchase History
| Date | Buyer | Sale Price | Title Company |
|---|---|---|---|
| Misir Muneshwar | $415,000 | All Shore Abstract Ltd | |
| Misir Muneshwar | $415,000 | -- | |
| Flanagan John J | -- | First American Title Ins Co |
Source: Public Records
Mortgage History
| Date | Status | Borrower | Loan Amount |
|---|---|---|---|
| Open | Misir Muneshwar | $407,483 |
Source: Public Records
Tax History
| Year | Tax Paid | Tax Assessment Tax Assessment Total Assessment is a certain percentage of the fair market value that is determined by local assessors to be the total taxable value of land and additions on the property. | Land | Improvement |
|---|---|---|---|---|
| 2024 | $15,672 | $3,735 | $160 | $3,575 |
| 2023 | $15,672 | $3,735 | $160 | $3,575 |
| 2022 | $12,696 | $3,735 | $160 | $3,575 |
| 2021 | $12,696 | $3,735 | $160 | $3,575 |
| 2020 | $14,268 | $3,735 | $160 | $3,575 |
| 2019 | $14,268 | $0 | $0 | $0 |
| 2018 | -- | $3,735 | $160 | $3,575 |
| 2017 | $13,209 | $3,735 | $160 | $3,575 |
| 2016 | $12,912 | $3,735 | $160 | $3,575 |
| 2015 | -- | $3,735 | $160 | $3,575 |
| 2014 | -- | $3,735 | $160 | $3,575 |
Source: Public Records
Map
Nearby Homes
- 60 Webb Ave
- 44 Prince St
- 25 Glen Hollow Dr Unit H-23
- 21 Glen Hollow Dr Unit G2
- 14 Glen Hollow Dr Unit E2
- 27 Denton St
- 10 Glen Hollow Dr Unit C1
- 10 Glen Hollow Dr Unit C12
- 60 Green Ave
- 6 Glen Hollow Dr Unit A33
- 20 E Shore Dr
- 19 Fairmont Ave
- 136 Patchogue Ave
- 6 Landings Ln
- 973 N Ocean Ave
- 511 Old North Ocean Ave
- 93 Winges Ave
- 123 9th Ave
- 12 Blue Point Rd E Unit 12
- 72 Harris St
Your Personal Tour Guide
Ask me questions while you tour the home.