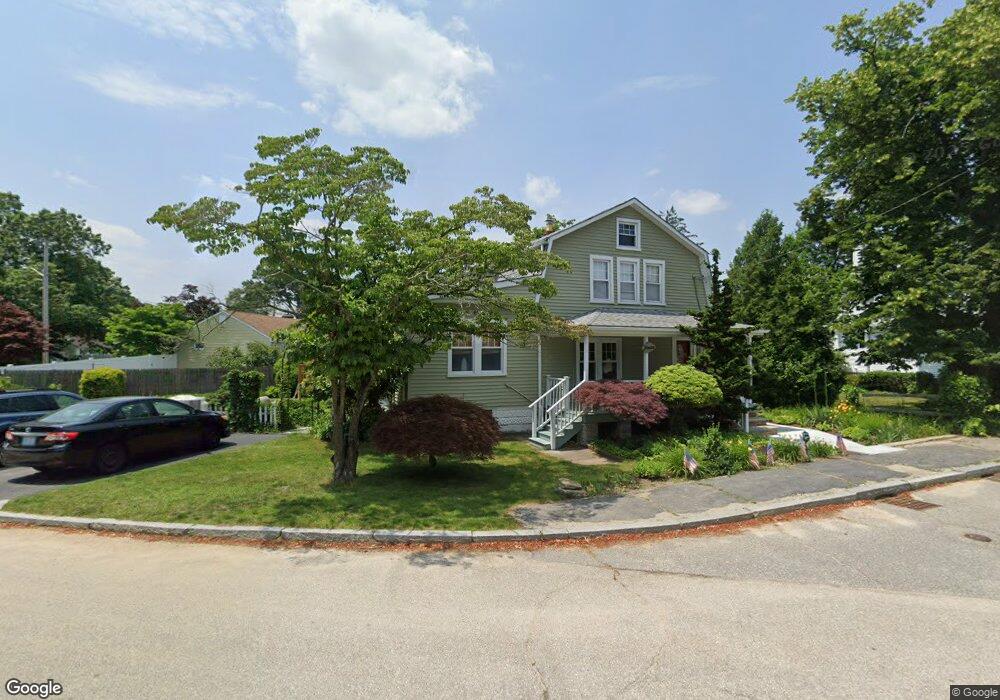
69 Malden St Cranston, RI 02910
Eden Park NeighborhoodEstimated Value: $377,000 - $495,000
3
Beds
2
Baths
1,488
Sq Ft
$291/Sq Ft
Est. Value
About This Home
This home is located at 69 Malden St, Cranston, RI 02910 and is currently estimated at $432,713, approximately $290 per square foot. 69 Malden St is a home located in Providence County with nearby schools including Park View Middle School, Cranston High School East, and Cadence Academy Preschool - Cranston.
Ownership History
Date
Name
Owned For
Owner Type
Purchase Details
Closed on
Jan 30, 2008
Sold by
Clifford Frederic and Clifford Patricai
Bought by
Johnston Robert T
Current Estimated Value
Home Financials for this Owner
Home Financials are based on the most recent Mortgage that was taken out on this home.
Original Mortgage
$190,000
Interest Rate
6.18%
Mortgage Type
Purchase Money Mortgage
Purchase Details
Closed on
Dec 7, 1988
Sold by
Cooney Marjorie Est
Bought by
Clifford Frederic E
Create a Home Valuation Report for This Property
The Home Valuation Report is an in-depth analysis detailing your home's value as well as a comparison with similar homes in the area
Home Values in the Area
Average Home Value in this Area
Purchase History
| Date | Buyer | Sale Price | Title Company |
|---|---|---|---|
| Johnston Robert T | $230,000 | -- | |
| Clifford Frederic E | $90,000 | -- |
Source: Public Records
Mortgage History
| Date | Status | Borrower | Loan Amount |
|---|---|---|---|
| Open | Clifford Frederic E | $183,915 | |
| Closed | Clifford Frederic E | $195,106 | |
| Closed | Clifford Frederic E | $190,000 | |
| Previous Owner | Clifford Frederic E | $83,200 |
Source: Public Records
Tax History
| Year | Tax Paid | Tax Assessment Tax Assessment Total Assessment is a certain percentage of the fair market value that is determined by local assessors to be the total taxable value of land and additions on the property. | Land | Improvement |
|---|---|---|---|---|
| 2025 | $4,472 | $322,200 | $98,800 | $223,400 |
| 2024 | $4,385 | $322,200 | $98,800 | $223,400 |
| 2023 | $4,090 | $216,400 | $65,100 | $151,300 |
| 2022 | $4,006 | $216,400 | $65,100 | $151,300 |
| 2021 | $3,895 | $216,400 | $65,100 | $151,300 |
| 2020 | $3,616 | $174,100 | $62,000 | $112,100 |
| 2019 | $3,616 | $174,100 | $62,000 | $112,100 |
| 2018 | $3,532 | $174,100 | $62,000 | $112,100 |
| 2017 | $3,441 | $150,000 | $55,800 | $94,200 |
| 2016 | $3,368 | $150,000 | $55,800 | $94,200 |
| 2015 | $3,368 | $150,000 | $55,800 | $94,200 |
| 2014 | $3,449 | $151,000 | $55,800 | $95,200 |
Source: Public Records
Map
Nearby Homes
- 10 Woburn St
- 103 Harper Ave
- 167 Forest Ave
- 150 Riverside Ave
- 10 Dale Ave
- 33 Hemlock Ave
- 64 Holburn Ave
- 47 Holburn Ave
- 25 Sharon St Unit 2
- 129 1st Ave
- 123 Harrington Ave
- 0 Elmwood Ave
- 859 Pontiac Ave
- 80 Colonial Ave
- 65 Perkins Ave
- 124 Clarence St
- 105 Fordson Ave
- 181 Grace St
- 36 Blackamore Ave
- 35 Welfare Ave
Your Personal Tour Guide
Ask me questions while you tour the home.