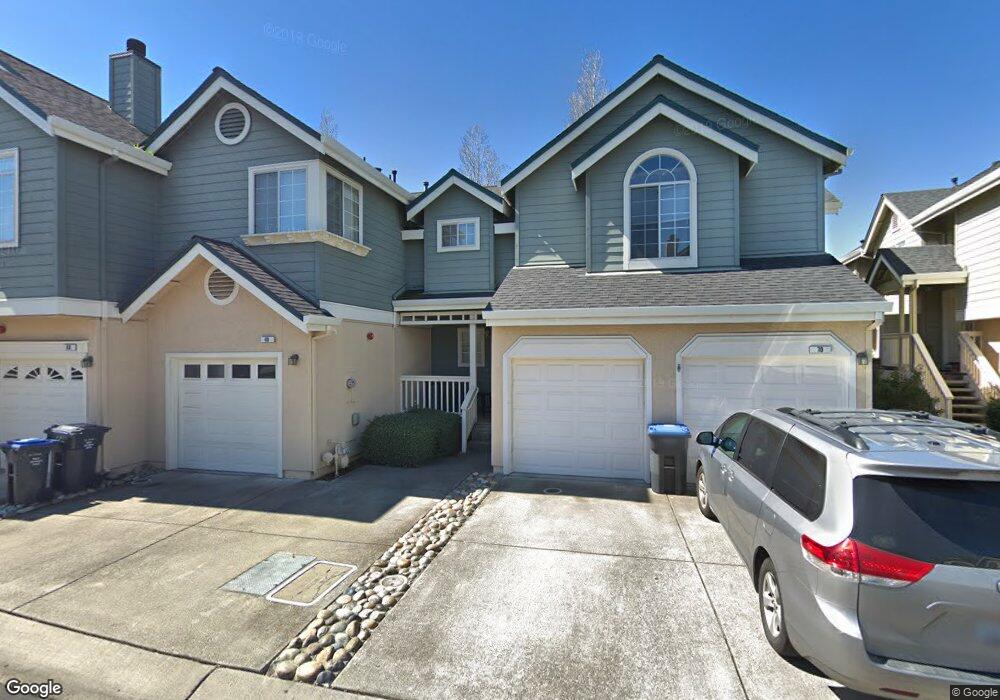
69 Manchester Dr Fairfield, CA 94533
Estimated Value: $401,741 - $439,000
3
Beds
2
Baths
1,349
Sq Ft
$311/Sq Ft
Est. Value
About This Home
This home is located at 69 Manchester Dr, Fairfield, CA 94533 and is currently estimated at $419,685, approximately $311 per square foot. 69 Manchester Dr is a home located in Solano County with nearby schools including Center Elementary School, Golden West Middle School, and Vanden High School.
Ownership History
Date
Name
Owned For
Owner Type
Purchase Details
Closed on
Dec 17, 2014
Sold by
Sligh Beverly F
Bought by
Blue Mountain Homes Llc
Current Estimated Value
Purchase Details
Closed on
Jun 28, 2005
Sold by
Vogel Joanne R and Vogel Gil
Bought by
Vogel Gil J and Vogel Joanne R
Purchase Details
Closed on
Dec 7, 2000
Sold by
Brienes Joanne R and Brienes Joanne R
Bought by
Vogel Gil and Vogel Joanne R
Purchase Details
Closed on
May 28, 1996
Sold by
Green David M and Green Sandra J
Bought by
Brienes Joanne R
Purchase Details
Closed on
Oct 15, 1993
Sold by
Cambridge Estates Ltd
Bought by
Green David M and Green Sandra J
Home Financials for this Owner
Home Financials are based on the most recent Mortgage that was taken out on this home.
Original Mortgage
$125,402
Interest Rate
6.81%
Mortgage Type
FHA
Create a Home Valuation Report for This Property
The Home Valuation Report is an in-depth analysis detailing your home's value as well as a comparison with similar homes in the area
Home Values in the Area
Average Home Value in this Area
Purchase History
| Date | Buyer | Sale Price | Title Company |
|---|---|---|---|
| Blue Mountain Homes Llc | $158,800 | None Available | |
| Vogel Gil J | -- | -- | |
| Vogel Gil | -- | Frontier Title Company | |
| Brienes Joanne R | -- | Frontier Title Company | |
| Green David M | $137,000 | Placer Title Company |
Source: Public Records
Mortgage History
| Date | Status | Borrower | Loan Amount |
|---|---|---|---|
| Previous Owner | Green David M | $125,402 |
Source: Public Records
Tax History
| Year | Tax Paid | Tax Assessment Tax Assessment Total Assessment is a certain percentage of the fair market value that is determined by local assessors to be the total taxable value of land and additions on the property. | Land | Improvement |
|---|---|---|---|---|
| 2025 | $2,297 | $219,275 | $58,137 | $161,138 |
| 2024 | $2,297 | $214,977 | $56,998 | $157,979 |
| 2023 | $2,256 | $210,763 | $55,881 | $154,882 |
| 2022 | $2,199 | $206,632 | $54,786 | $151,846 |
| 2021 | $2,170 | $202,581 | $53,712 | $148,869 |
| 2020 | $2,145 | $200,505 | $53,162 | $147,343 |
| 2019 | $2,106 | $196,574 | $52,120 | $144,454 |
| 2018 | $2,082 | $192,721 | $51,099 | $141,622 |
| 2017 | $2,014 | $188,944 | $50,098 | $138,846 |
| 2016 | $1,983 | $185,240 | $49,116 | $136,124 |
| 2015 | $1,953 | $182,459 | $48,379 | $134,080 |
| 2014 | $1,835 | $171,000 | $43,000 | $128,000 |
Source: Public Records
Map
Nearby Homes
- 40 Manchester Ln
- 2753 Whitney Dr Unit 1
- 2950 Gammon Ct
- 2600 Industrial Dr
- 198 Dobe Ln
- 2438 Sheldon Dr
- 5018 Brown Ln
- 2541 Rowe Dr
- 2429 Artisan Way
- 2426 Lake Club Dr
- 212 Valencia Dr
- 157 Zafra Dr
- 1648 Tucson Cir
- 2464 Lake Club Dr
- 58 Barcelona Ct
- 2084 Parsons Dr
- 2282 Solace Vista
- 1617 Tucson Cir
- 137 Valencia Dr
- 86 Biltmore Ct
- 68 Manchester Dr
- 70 Manchester Dr
- 67 Manchester Dr
- 71 Manchester Dr
- 72 Manchester Dr
- 73 Manchester Dr
- 74 Manchester Dr
- 83 Manchester Dr
- 65 Manchester Dr
- 82 Manchester Dr
- 86 Manchester Dr
- 80 Manchester Dr
- 81 Manchester Dr
- 75 Manchester Dr
- 88 Manchester Dr
- 66 Manchester Dr
- 84 Manchester Dr
- 85 Manchester Dr
- 64 Manchester Dr
- 87 Manchester Dr
Your Personal Tour Guide
Ask me questions while you tour the home.