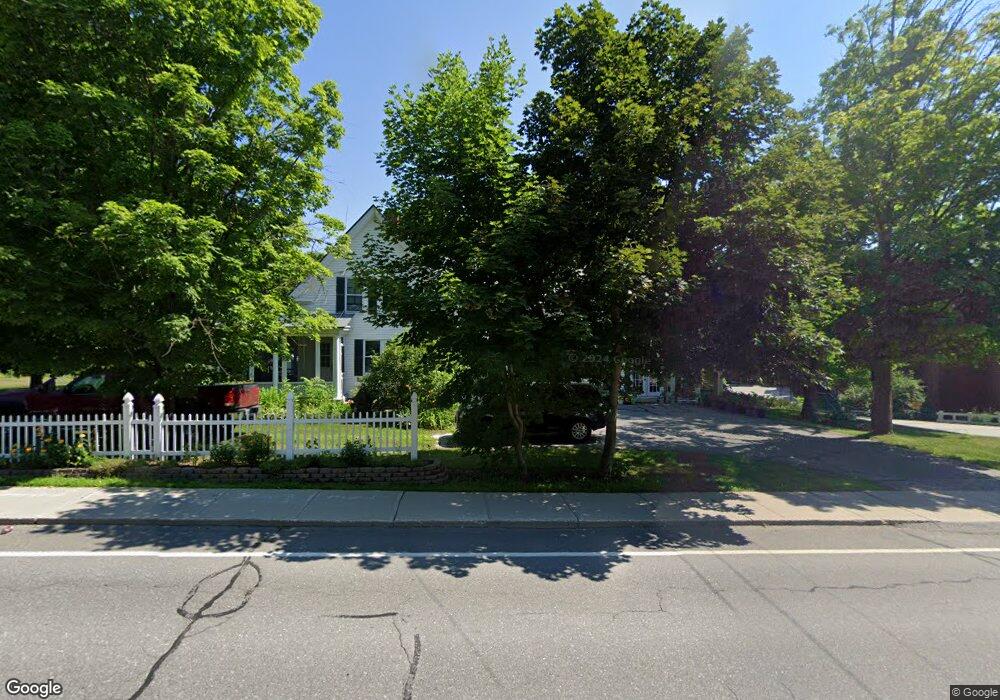
69 Maple Ave Claremont, NH 03743
Maple Avenue District NeighborhoodEstimated Value: $329,000 - $365,727
3
Beds
2
Baths
2,014
Sq Ft
$173/Sq Ft
Est. Value
About This Home
This home is located at 69 Maple Ave, Claremont, NH 03743 and is currently estimated at $347,432, approximately $172 per square foot. 69 Maple Ave is a home located in Sullivan County with nearby schools including Maple Avenue School, Claremont Middle School, and Stevens High School.
Ownership History
Date
Name
Owned For
Owner Type
Purchase Details
Closed on
Jun 30, 2005
Sold by
Cullison Gary Wayne and Cullison Karen Denise
Bought by
Bandanza Paul W and Bandanza Cheryl J
Current Estimated Value
Home Financials for this Owner
Home Financials are based on the most recent Mortgage that was taken out on this home.
Original Mortgage
$12,490
Interest Rate
5.73%
Mortgage Type
Purchase Money Mortgage
Purchase Details
Closed on
Aug 25, 2000
Sold by
Marro Albert C and Marro Alberta A
Bought by
Cullison Gary Wayne
Home Financials for this Owner
Home Financials are based on the most recent Mortgage that was taken out on this home.
Original Mortgage
$103,000
Interest Rate
8.06%
Create a Home Valuation Report for This Property
The Home Valuation Report is an in-depth analysis detailing your home's value as well as a comparison with similar homes in the area
Home Values in the Area
Average Home Value in this Area
Purchase History
| Date | Buyer | Sale Price | Title Company |
|---|---|---|---|
| Bandanza Paul W | $179,900 | -- | |
| Cullison Gary Wayne | $115,000 | -- |
Source: Public Records
Mortgage History
| Date | Status | Borrower | Loan Amount |
|---|---|---|---|
| Open | Cullison Gary Wayne | $56,750 | |
| Closed | Cullison Gary Wayne | $12,490 | |
| Previous Owner | Cullison Gary Wayne | $103,000 |
Source: Public Records
Tax History Compared to Growth
Tax History
| Year | Tax Paid | Tax Assessment Tax Assessment Total Assessment is a certain percentage of the fair market value that is determined by local assessors to be the total taxable value of land and additions on the property. | Land | Improvement |
|---|---|---|---|---|
| 2024 | $8,766 | $299,600 | $47,100 | $252,500 |
| 2023 | $8,329 | $299,600 | $47,100 | $252,500 |
| 2022 | $6,902 | $165,600 | $23,000 | $142,600 |
| 2021 | $6,786 | $165,600 | $23,000 | $142,600 |
| 2020 | $6,788 | $166,700 | $23,000 | $143,700 |
| 2019 | $6,711 | $166,700 | $23,000 | $143,700 |
| 2018 | $7,112 | $169,000 | $23,000 | $146,000 |
| 2017 | $7,094 | $166,300 | $23,000 | $143,300 |
| 2016 | $7,088 | $166,300 | $23,000 | $143,300 |
| 2015 | $6,896 | $166,300 | $23,000 | $143,300 |
| 2014 | $6,873 | $166,300 | $23,000 | $143,300 |
| 2013 | $6,485 | $178,900 | $24,600 | $154,300 |
Source: Public Records
Map
Nearby Homes