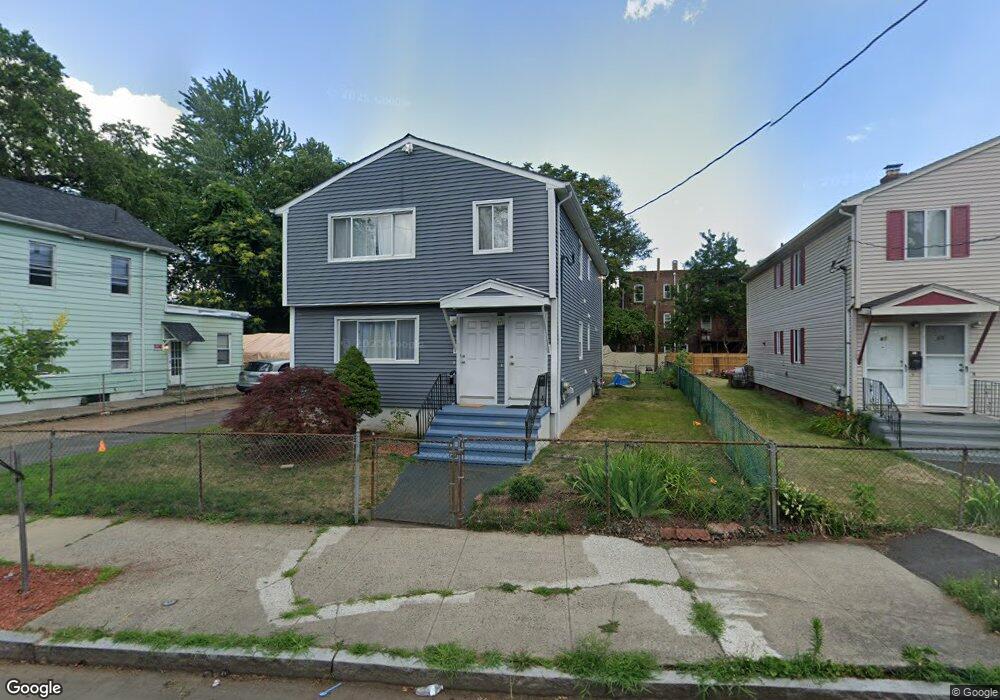
69 Monroe St New Haven, CT 06513
Fair Haven NeighborhoodEstimated Value: $366,285 - $485,000
3
Beds
1
Bath
2,232
Sq Ft
$180/Sq Ft
Est. Value
About This Home
This home is located at 69 Monroe St, New Haven, CT 06513 and is currently estimated at $402,321, approximately $180 per square foot. 69 Monroe St is a home located in New Haven County with nearby schools including Clinton Avenue School, Elm City College Preparatory School, and Booker T. Washington Academy.
Ownership History
Date
Name
Owned For
Owner Type
Purchase Details
Closed on
Mar 19, 2021
Sold by
Perez Juan
Bought by
Almonte-Guzman Cristian
Current Estimated Value
Home Financials for this Owner
Home Financials are based on the most recent Mortgage that was taken out on this home.
Original Mortgage
$250,381
Outstanding Balance
$224,563
Interest Rate
2.73%
Mortgage Type
FHA
Estimated Equity
$177,758
Purchase Details
Closed on
Apr 24, 2006
Sold by
Bo Kong
Bought by
Perez Juan
Home Financials for this Owner
Home Financials are based on the most recent Mortgage that was taken out on this home.
Original Mortgage
$204,000
Interest Rate
7.95%
Purchase Details
Closed on
May 1, 2000
Sold by
Proto Frances
Bought by
Bo Kong
Home Financials for this Owner
Home Financials are based on the most recent Mortgage that was taken out on this home.
Original Mortgage
$92,280
Interest Rate
8.23%
Create a Home Valuation Report for This Property
The Home Valuation Report is an in-depth analysis detailing your home's value as well as a comparison with similar homes in the area
Home Values in the Area
Average Home Value in this Area
Purchase History
| Date | Buyer | Sale Price | Title Company |
|---|---|---|---|
| Almonte-Guzman Cristian | $255,000 | None Available | |
| Perez Juan | $255,000 | -- | |
| Bo Kong | $95,000 | -- |
Source: Public Records
Mortgage History
| Date | Status | Borrower | Loan Amount |
|---|---|---|---|
| Open | Almonte-Guzman Cristian | $250,381 | |
| Previous Owner | Bo Kong | $204,000 | |
| Previous Owner | Bo Kong | $51,000 | |
| Previous Owner | Bo Kong | $92,280 |
Source: Public Records
Tax History Compared to Growth
Tax History
| Year | Tax Paid | Tax Assessment Tax Assessment Total Assessment is a certain percentage of the fair market value that is determined by local assessors to be the total taxable value of land and additions on the property. | Land | Improvement |
|---|---|---|---|---|
| 2025 | $6,161 | $156,380 | $28,630 | $127,750 |
| 2024 | $6,021 | $156,380 | $28,630 | $127,750 |
| 2023 | $5,817 | $156,380 | $28,630 | $127,750 |
| 2022 | $6,216 | $156,380 | $28,630 | $127,750 |
| 2021 | $4,125 | $94,010 | $22,890 | $71,120 |
| 2020 | $4,125 | $94,010 | $22,890 | $71,120 |
| 2019 | $4,041 | $94,010 | $22,890 | $71,120 |
| 2018 | $4,041 | $94,010 | $22,890 | $71,120 |
| 2017 | $3,636 | $94,010 | $22,890 | $71,120 |
| 2016 | $3,153 | $75,880 | $15,260 | $60,620 |
| 2015 | $3,153 | $75,880 | $15,260 | $60,620 |
| 2014 | $3,153 | $75,880 | $15,260 | $60,620 |
Source: Public Records
Map
Nearby Homes