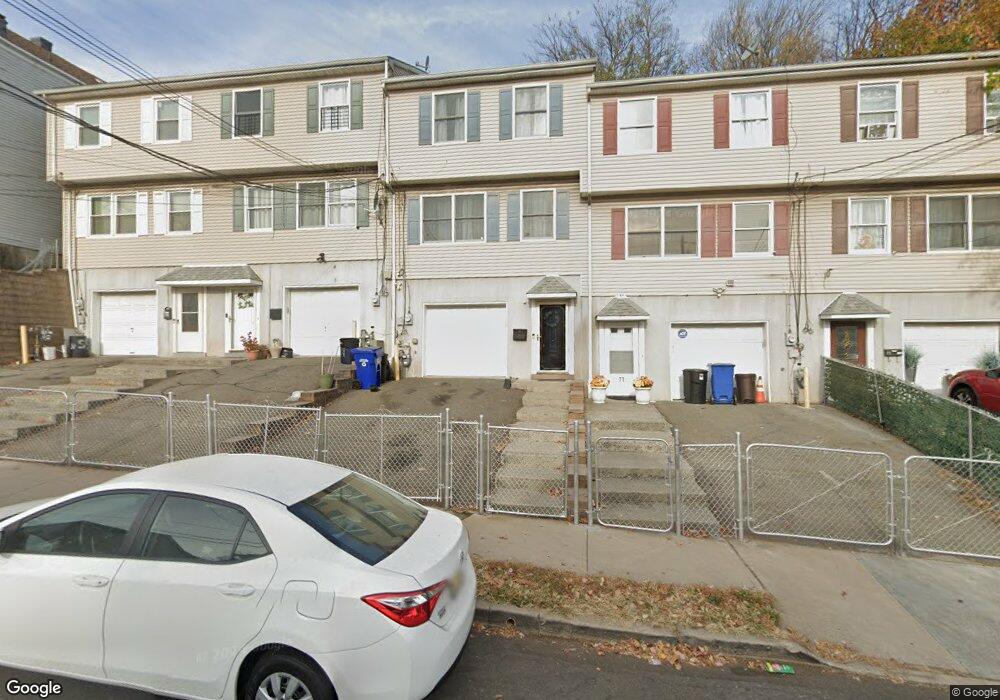
69 N 4th St Paterson, NJ 07522
Northside NeighborhoodEstimated Value: $307,199 - $524,000
--
Bed
--
Bath
1,206
Sq Ft
$348/Sq Ft
Est. Value
About This Home
This home is located at 69 N 4th St, Paterson, NJ 07522 and is currently estimated at $419,300, approximately $347 per square foot. 69 N 4th St is a home located in Passaic County with nearby schools including Edward W. Kilpatrick School of Discovery, Dale Avenue Elementary School, and Dr. Frank Napier, Jr. School of Technology.
Ownership History
Date
Name
Owned For
Owner Type
Purchase Details
Closed on
Oct 16, 2002
Sold by
Paterson Habitat
Bought by
Calderon Julio and Calderon Jesus
Current Estimated Value
Home Financials for this Owner
Home Financials are based on the most recent Mortgage that was taken out on this home.
Original Mortgage
$70,635
Outstanding Balance
$29,332
Interest Rate
6.03%
Estimated Equity
$389,968
Create a Home Valuation Report for This Property
The Home Valuation Report is an in-depth analysis detailing your home's value as well as a comparison with similar homes in the area
Home Values in the Area
Average Home Value in this Area
Purchase History
| Date | Buyer | Sale Price | Title Company |
|---|---|---|---|
| Calderon Julio | $76,000 | -- |
Source: Public Records
Mortgage History
| Date | Status | Borrower | Loan Amount |
|---|---|---|---|
| Open | Calderon Julio | $70,635 |
Source: Public Records
Tax History Compared to Growth
Tax History
| Year | Tax Paid | Tax Assessment Tax Assessment Total Assessment is a certain percentage of the fair market value that is determined by local assessors to be the total taxable value of land and additions on the property. | Land | Improvement |
|---|---|---|---|---|
| 2025 | $5,161 | $101,300 | $20,000 | $81,300 |
| 2024 | $4,967 | $101,300 | $20,000 | $81,300 |
| 2022 | $4,702 | $101,300 | $20,000 | $81,300 |
| 2021 | $4,534 | $101,300 | $20,000 | $81,300 |
| 2020 | $4,229 | $101,300 | $20,000 | $81,300 |
| 2019 | $4,188 | $101,300 | $20,000 | $81,300 |
| 2018 | $4,382 | $101,300 | $20,000 | $81,300 |
| 2017 | $3,794 | $91,200 | $20,000 | $71,200 |
| 2016 | $3,957 | $91,200 | $20,000 | $71,200 |
| 2015 | $3,747 | $91,200 | $20,000 | $71,200 |
| 2014 | $2,445 | $84,300 | $50,000 | $34,300 |
Source: Public Records
Map
Nearby Homes