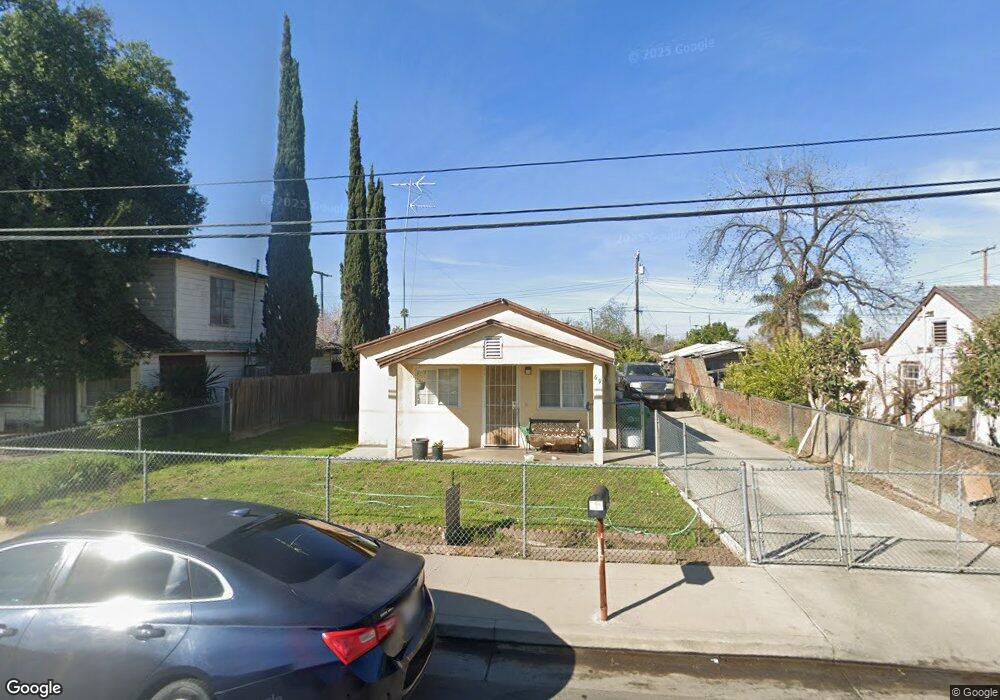
69 N Prospect St Porterville, CA 93257
Porterville Northwest NeighborhoodEstimated Value: $173,856 - $253,000
2
Beds
1
Bath
1,000
Sq Ft
$225/Sq Ft
Est. Value
About This Home
This home is located at 69 N Prospect St, Porterville, CA 93257 and is currently estimated at $225,214, approximately $225 per square foot. 69 N Prospect St is a home located in Tulare County with nearby schools including West Putnam Elementary School, Sequoia Middle School, and Monache High School.
Ownership History
Date
Name
Owned For
Owner Type
Purchase Details
Closed on
Mar 8, 2010
Sold by
Corona Alberto M
Bought by
Corona Alberto and Corona Jose S
Current Estimated Value
Purchase Details
Closed on
Feb 21, 2001
Sold by
Hernandez Bonifacio M
Bought by
Corona Alberto M
Home Financials for this Owner
Home Financials are based on the most recent Mortgage that was taken out on this home.
Original Mortgage
$52,530
Interest Rate
6.98%
Mortgage Type
FHA
Create a Home Valuation Report for This Property
The Home Valuation Report is an in-depth analysis detailing your home's value as well as a comparison with similar homes in the area
Home Values in the Area
Average Home Value in this Area
Purchase History
| Date | Buyer | Sale Price | Title Company |
|---|---|---|---|
| Corona Alberto | -- | None Available | |
| Corona Alberto M | $53,000 | Chicago Title Co |
Source: Public Records
Mortgage History
| Date | Status | Borrower | Loan Amount |
|---|---|---|---|
| Previous Owner | Corona Alberto M | $52,530 |
Source: Public Records
Tax History Compared to Growth
Tax History
| Year | Tax Paid | Tax Assessment Tax Assessment Total Assessment is a certain percentage of the fair market value that is determined by local assessors to be the total taxable value of land and additions on the property. | Land | Improvement |
|---|---|---|---|---|
| 2025 | $772 | $79,863 | $27,121 | $52,742 |
| 2024 | $772 | $78,298 | $26,590 | $51,708 |
| 2023 | $770 | $76,764 | $26,069 | $50,695 |
| 2022 | $745 | $75,259 | $25,558 | $49,701 |
| 2021 | $735 | $73,783 | $25,057 | $48,726 |
| 2020 | $726 | $73,026 | $24,800 | $48,226 |
| 2019 | $712 | $71,594 | $24,314 | $47,280 |
| 2018 | $697 | $70,190 | $23,837 | $46,353 |
| 2017 | $679 | $68,814 | $23,370 | $45,444 |
| 2016 | $650 | $67,465 | $22,912 | $44,553 |
| 2015 | $622 | $66,452 | $22,568 | $43,884 |
| 2014 | $622 | $65,150 | $22,126 | $43,024 |
Source: Public Records
Map
Nearby Homes
- 53 N Prospect St
- 1140 Tomah Ave
- 1262 Tomah Ave
- 1147 W Putnam Ave
- 1137 W Putnam Ave
- 66 S Beverly St
- 63 N Wisconsin St
- 1066 W Forest Ave
- 1343 W Morton Ave Unit Sp 84
- 1127 W Orange Ave
- 360 N Capitola Ct Unit 4
- 0 W Morton Unit 234694
- 474 Douglas St
- 1087 W Belleview Ave
- 1060 W Belleview Ave
- 347 Ohio Cir
- 553 S Cloverleaf St
- 36 S Chess Terrace St
- 640 N Prospect St
- 293 N Villa St
- 77 N Prospect St
- 63 N Prospect St
- 53 N Prospect St Unit 4
- 66 Dameron St
- 60 Dameron St
- 78 Dameron St
- 52 Dameron St
- 91 N Prospect St
- 1203 Tomah Ave
- 70 N Prospect St
- 64 N Prospect St
- 1207 Tomah Ave
- 80 N Prospect St
- 44 N Prospect St
- 94 Dameron St
- 90 N Prospect St
- 34 N Prospect St
- 107 N Prospect St
- 1194 W Olive Ave
- 1141 Tomah Ave