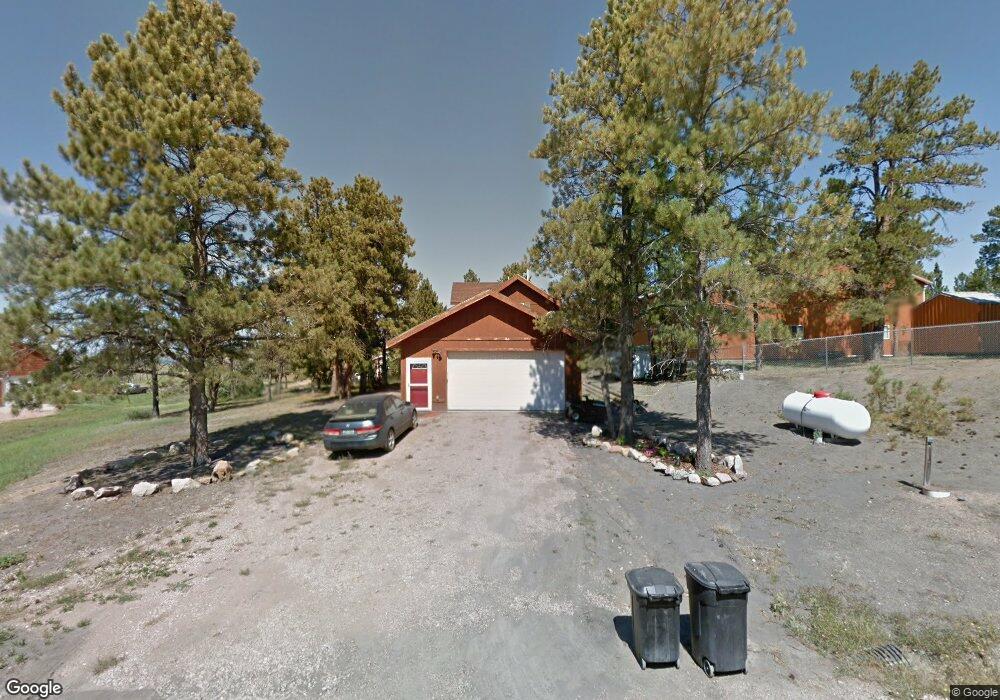
69 Pendleton Dr Pine Haven, WY 82721
Estimated Value: $354,717 - $395,000
4
Beds
2
Baths
2,200
Sq Ft
$172/Sq Ft
Est. Value
About This Home
This home is located at 69 Pendleton Dr, Pine Haven, WY 82721 and is currently estimated at $379,429, approximately $172 per square foot. 69 Pendleton Dr is a home with nearby schools including Hulett School, Bear Lodge High School, and Moorcroft High School.
Ownership History
Date
Name
Owned For
Owner Type
Purchase Details
Closed on
Dec 10, 2025
Sold by
Cook Lacey
Bought by
Reiher Skylar and Reiher Jennifer Lynn
Current Estimated Value
Home Financials for this Owner
Home Financials are based on the most recent Mortgage that was taken out on this home.
Original Mortgage
$359,100
Outstanding Balance
$359,100
Interest Rate
6.22%
Mortgage Type
New Conventional
Estimated Equity
$20,329
Purchase Details
Closed on
Sep 13, 2007
Sold by
Carey Scott R
Bought by
Cook Tell and Cook Lacey
Home Financials for this Owner
Home Financials are based on the most recent Mortgage that was taken out on this home.
Original Mortgage
$239,000
Interest Rate
6.7%
Mortgage Type
New Conventional
Purchase Details
Closed on
Aug 4, 2006
Sold by
Popkes Jd
Bought by
Carey Scott R
Home Financials for this Owner
Home Financials are based on the most recent Mortgage that was taken out on this home.
Original Mortgage
$225,000
Interest Rate
6.66%
Mortgage Type
VA
Create a Home Valuation Report for This Property
The Home Valuation Report is an in-depth analysis detailing your home's value as well as a comparison with similar homes in the area
Purchase History
| Date | Buyer | Sale Price | Title Company |
|---|---|---|---|
| Reiher Skylar | -- | None Listed On Document | |
| Cook Tell | -- | None Available | |
| Carey Scott R | -- | None Available |
Source: Public Records
Mortgage History
| Date | Status | Borrower | Loan Amount |
|---|---|---|---|
| Open | Reiher Skylar | $359,100 | |
| Previous Owner | Cook Tell | $239,000 | |
| Previous Owner | Carey Scott R | $225,000 |
Source: Public Records
Tax History
| Year | Tax Paid | Tax Assessment Tax Assessment Total Assessment is a certain percentage of the fair market value that is determined by local assessors to be the total taxable value of land and additions on the property. | Land | Improvement |
|---|---|---|---|---|
| 2025 | $1,750 | $20,121 | $4,111 | $16,010 |
| 2024 | $1,750 | $26,801 | $5,270 | $21,531 |
| 2023 | $1,535 | $24,818 | $3,949 | $20,869 |
| 2022 | $1,535 | $21,768 | $3,221 | $18,547 |
| 2021 | $1,388 | $19,681 | $2,979 | $16,702 |
| 2020 | $1,301 | $18,452 | $3,379 | $15,073 |
| 2019 | -- | $18,420 | $3,563 | $14,857 |
| 2018 | $0 | $19,186 | $3,464 | $15,722 |
| 2017 | $0 | $17,980 | $3,443 | $14,537 |
| 2016 | -- | $18,985 | $3,443 | $15,542 |
| 2015 | -- | $14,943 | $3,507 | $11,436 |
| 2014 | -- | $16,997 | $2,042 | $14,955 |
Source: Public Records
Map
Nearby Homes
- 71 Pendleton Dr
- 33 Pendleton Dr
- 25 Pendleton Dr
- Tbd Empire Dr
- 10 Freedom Dr W
- 4 Freedom Dr W
- 14 Freedom Dr W
- 21 Freedom Dr W
- 13 Freedom Dr W
- 17 Freedom Dr W
- 18 Freedom Dr W
- 3 Freedom Dr W
- 16 Pine Crest Dr
- 20 Pine Crest Dr
- 5 Freedom Dr E
- 9 Big Buck Dr
- 21 Pine Crest Dr
- 17 Pine Crest Dr
- 25 Pine Crest Dr
- 4 Pine Crest Dr
- 45 Pendleton Dr
- 43 Pendleton Dr
- 64 Pendleton Dr
- 73 Pendleton Dr
- 74 Pendleton Dr
- 47 Pendleton Dr
- 41 Pendleton Dr
- 31 Pendleton Dr
- 75 Pendleton Dr
- 44 Pendleton Dr
- 26 Pendleton Dr
- 76 Pendleton Dr
- 48 Pendleton Dr
- 24 Empire Ln
- 27 Pendleton Dr
- 62 Pendleton Dr
- 30 Pendleton Dr
- 59 Pendleton Dr
- 34 Pendleton Dr -
- 11 Empire Ln
Your Personal Tour Guide
Ask me questions while you tour the home.