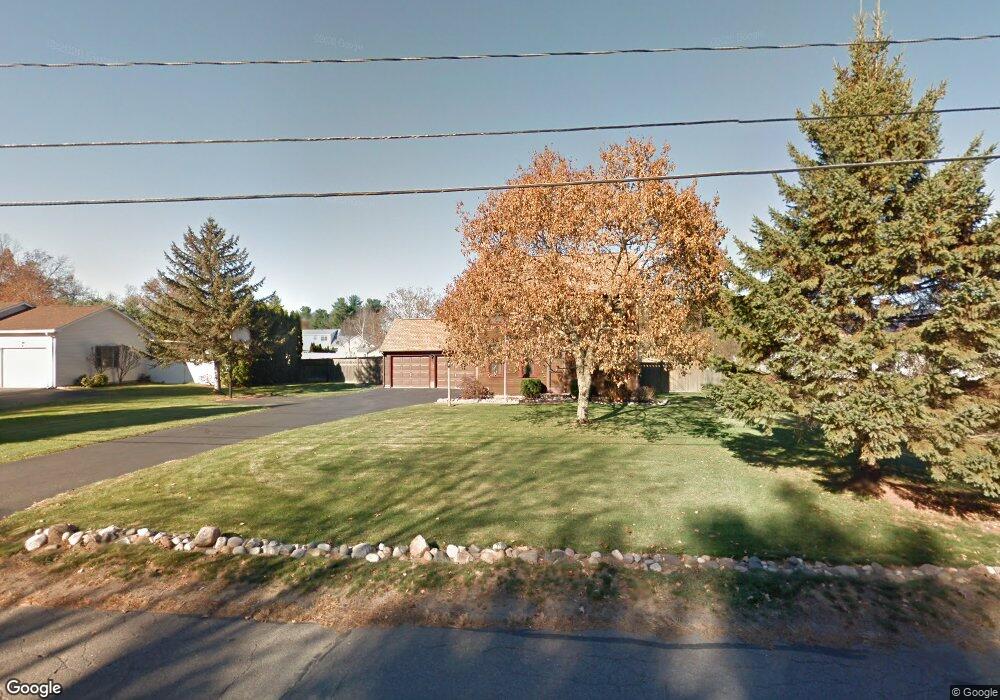
69 Plain St Easthampton, MA 01027
Estimated Value: $500,000 - $558,000
3
Beds
3
Baths
1,676
Sq Ft
$316/Sq Ft
Est. Value
About This Home
This home is located at 69 Plain St, Easthampton, MA 01027 and is currently estimated at $529,703, approximately $316 per square foot. 69 Plain St is a home located in Hampshire County with nearby schools including Easthampton High School, Calvary Baptist Christian School, and Tri-County Schools.
Ownership History
Date
Name
Owned For
Owner Type
Purchase Details
Closed on
Jul 28, 2023
Sold by
Carmel Robert E and Carmel Susan M
Bought by
Devine
Current Estimated Value
Purchase Details
Closed on
Apr 29, 1992
Sold by
Sain Germain Kathleen and Meiers Mark S
Bought by
Carmel Robert E and Carmel Susan M
Create a Home Valuation Report for This Property
The Home Valuation Report is an in-depth analysis detailing your home's value as well as a comparison with similar homes in the area
Home Values in the Area
Average Home Value in this Area
Purchase History
| Date | Buyer | Sale Price | Title Company |
|---|---|---|---|
| Devine | -- | None Available | |
| Carmel Robert E | $135,000 | -- |
Source: Public Records
Mortgage History
| Date | Status | Borrower | Loan Amount |
|---|---|---|---|
| Previous Owner | Carmel Robert E | $65,000 | |
| Previous Owner | Carmel Robert E | $89,000 | |
| Previous Owner | Carmel Robert E | $50,000 | |
| Previous Owner | Carmel Robert E | $125,500 |
Source: Public Records
Tax History Compared to Growth
Tax History
| Year | Tax Paid | Tax Assessment Tax Assessment Total Assessment is a certain percentage of the fair market value that is determined by local assessors to be the total taxable value of land and additions on the property. | Land | Improvement |
|---|---|---|---|---|
| 2025 | $6,079 | $444,700 | $110,300 | $334,400 |
| 2024 | $5,912 | $436,000 | $107,200 | $328,800 |
| 2023 | $4,442 | $303,200 | $84,700 | $218,500 |
| 2022 | $5,012 | $303,200 | $84,700 | $218,500 |
| 2021 | $5,520 | $314,700 | $84,700 | $230,000 |
| 2020 | $5,385 | $303,200 | $84,700 | $218,500 |
| 2019 | $4,616 | $298,600 | $84,700 | $213,900 |
| 2018 | $4,443 | $277,700 | $79,800 | $197,900 |
| 2017 | $4,339 | $267,700 | $76,700 | $191,000 |
| 2016 | $4,334 | $278,000 | $76,700 | $201,300 |
| 2015 | $4,212 | $278,000 | $76,700 | $201,300 |
Source: Public Records
Map
Nearby Homes
- 4 Laurel Dr
- 245 Park St
- 1 Plain St
- 36 Line St
- 2 W Park Dr
- 95 Gunn Rd
- 6 S St & Abutting Lots
- 41 South St Unit 11
- 48 Gunn Rd
- 7 Western View Rd
- 38 College Hwy
- 385 Main St
- 19 Mount Tom Ave Unit 19
- M143 &152 Glendale St
- 19 Nicols Way Unit 19
- 33 Knipfer Ave
- 12 Golden Cir
- 36 County Rd
- 10 Golden Cir
- Lot 3R Pomeroy Meadow Rd