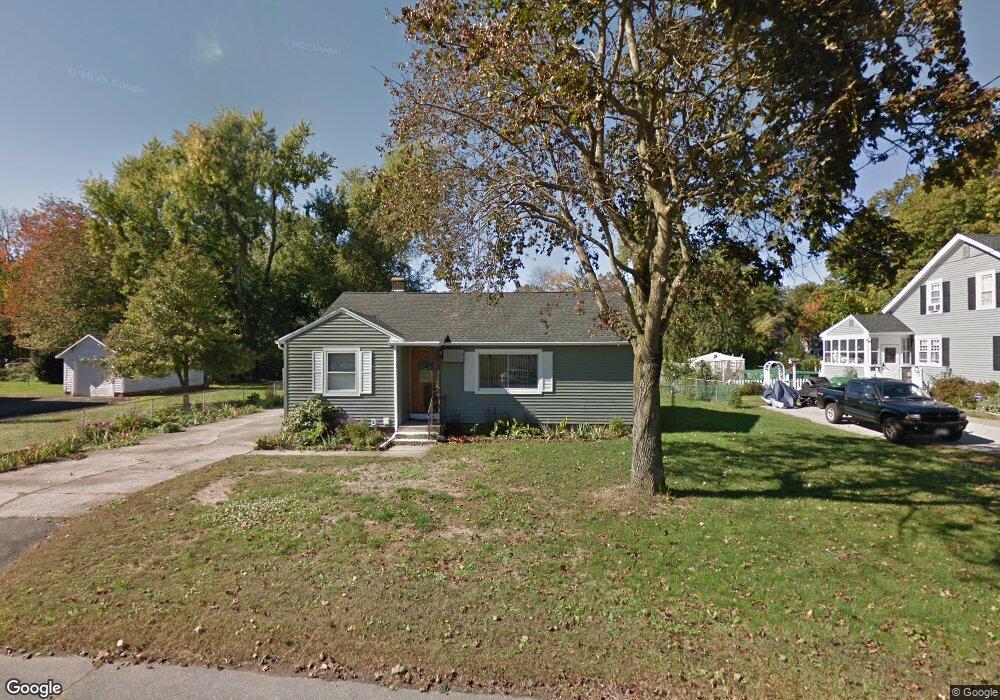
69 Pond St Ludlow, MA 01056
Estimated Value: $284,000 - $340,000
3
Beds
1
Bath
1,000
Sq Ft
$314/Sq Ft
Est. Value
About This Home
This home is located at 69 Pond St, Ludlow, MA 01056 and is currently estimated at $314,375, approximately $314 per square foot. 69 Pond St is a home located in Hampden County with nearby schools including East Street Elementary School, Chapin Street Elementary School, and Paul R. Baird Middle School.
Ownership History
Date
Name
Owned For
Owner Type
Purchase Details
Closed on
Oct 10, 2012
Sold by
Malaquias Julia R
Bought by
Malaquias Julia R and Kennedy Darlene
Current Estimated Value
Purchase Details
Closed on
Apr 30, 2002
Sold by
Jorge Amilcar S and Peixoto Maria I
Bought by
Malaquias Albino S and Malaquias Julia R
Create a Home Valuation Report for This Property
The Home Valuation Report is an in-depth analysis detailing your home's value as well as a comparison with similar homes in the area
Home Values in the Area
Average Home Value in this Area
Purchase History
| Date | Buyer | Sale Price | Title Company |
|---|---|---|---|
| Malaquias Julia R | -- | -- | |
| Malaquias Julia R | -- | -- | |
| Malaquias Albino S | $110,000 | -- | |
| Malaquias Albino S | $110,000 | -- |
Source: Public Records
Mortgage History
| Date | Status | Borrower | Loan Amount |
|---|---|---|---|
| Previous Owner | Malaquias Albino S | $23,000 |
Source: Public Records
Tax History
| Year | Tax Paid | Tax Assessment Tax Assessment Total Assessment is a certain percentage of the fair market value that is determined by local assessors to be the total taxable value of land and additions on the property. | Land | Improvement |
|---|---|---|---|---|
| 2025 | $4,683 | $269,900 | $84,800 | $185,100 |
| 2024 | $4,557 | $251,900 | $84,800 | $167,100 |
| 2023 | $4,345 | $222,700 | $77,600 | $145,100 |
| 2022 | $3,884 | $194,300 | $71,100 | $123,200 |
| 2021 | $3,896 | $184,800 | $71,100 | $113,700 |
| 2020 | $3,734 | $181,100 | $70,100 | $111,000 |
| 2019 | $3,465 | $174,800 | $69,400 | $105,400 |
| 2018 | $3,247 | $170,800 | $69,400 | $101,400 |
| 2017 | $3,146 | $169,800 | $68,000 | $101,800 |
| 2016 | $2,962 | $163,400 | $66,700 | $96,700 |
| 2015 | $2,808 | $162,400 | $66,000 | $96,400 |
Source: Public Records
Map
Nearby Homes
- 57 Belmont St
- Lot 602 Grandview Ave
- 0 Fuller St Unit 73409741
- 70 Fuller St
- 98 Fuller St Unit 32
- 119 Blisswood Village Dr
- 14 Arthur St
- 350 West Ave Unit 5
- 39 Rogers Ave
- 382 Holyoke St
- 42 Loopley St
- 102 Swan Ave
- 26 Swan Ave
- 0 N S Main St Io
- 295 Main St
- 201 Main St
- 166-168 Main St
- 47 Kendall St
- 42 Roy St
- 46-48 Milton St
Your Personal Tour Guide
Ask me questions while you tour the home.