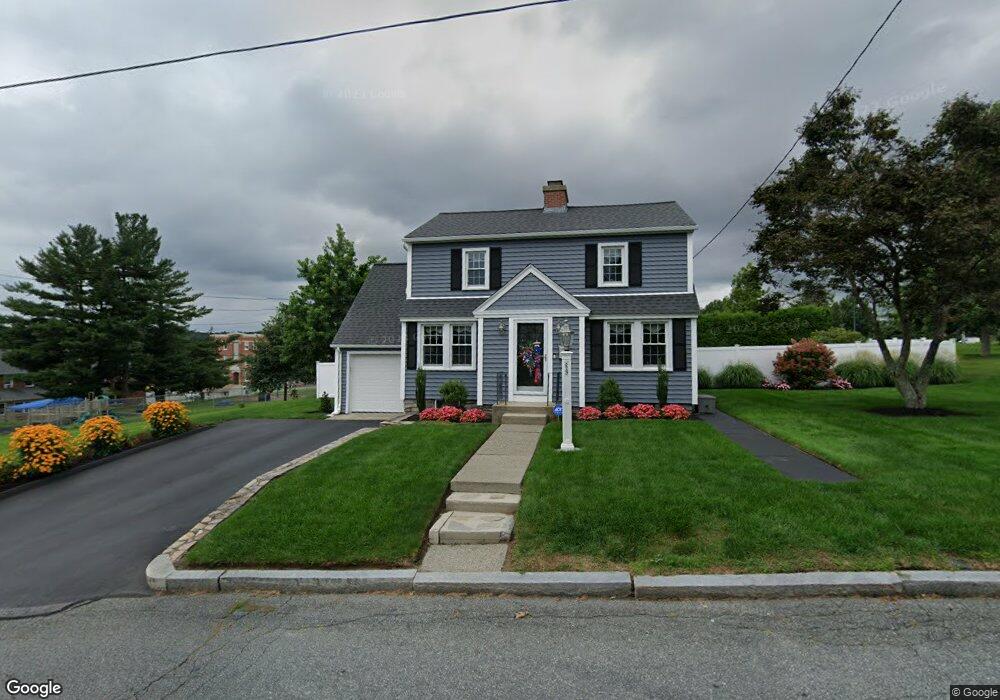
69 Randall St Worcester, MA 01606
Greendale NeighborhoodEstimated Value: $401,000 - $466,000
3
Beds
1
Bath
1,448
Sq Ft
$302/Sq Ft
Est. Value
About This Home
This home is located at 69 Randall St, Worcester, MA 01606 and is currently estimated at $437,332, approximately $302 per square foot. 69 Randall St is a home located in Worcester County with nearby schools including Belmont Street Community School, Jacob Hiatt Magnet School, and Chandler Magnet.
Ownership History
Date
Name
Owned For
Owner Type
Purchase Details
Closed on
Feb 4, 2016
Sold by
Lemire Edward M
Bought by
Lemire Kathleen A and Lemire Edward
Current Estimated Value
Home Financials for this Owner
Home Financials are based on the most recent Mortgage that was taken out on this home.
Original Mortgage
$125,000
Outstanding Balance
$98,118
Interest Rate
3.98%
Mortgage Type
New Conventional
Estimated Equity
$339,214
Create a Home Valuation Report for This Property
The Home Valuation Report is an in-depth analysis detailing your home's value as well as a comparison with similar homes in the area
Home Values in the Area
Average Home Value in this Area
Purchase History
| Date | Buyer | Sale Price | Title Company |
|---|---|---|---|
| Lemire Kathleen A | -- | -- |
Source: Public Records
Mortgage History
| Date | Status | Borrower | Loan Amount |
|---|---|---|---|
| Open | Lemire Kathleen A | $125,000 |
Source: Public Records
Tax History
| Year | Tax Paid | Tax Assessment Tax Assessment Total Assessment is a certain percentage of the fair market value that is determined by local assessors to be the total taxable value of land and additions on the property. | Land | Improvement |
|---|---|---|---|---|
| 2025 | $4,908 | $372,100 | $118,800 | $253,300 |
| 2024 | $4,822 | $350,700 | $118,800 | $231,900 |
| 2023 | $4,615 | $321,800 | $103,300 | $218,500 |
| 2022 | $4,234 | $278,400 | $82,700 | $195,700 |
| 2021 | $4,031 | $247,600 | $66,100 | $181,500 |
| 2020 | $3,919 | $230,500 | $66,100 | $164,400 |
| 2019 | $3,769 | $209,400 | $59,600 | $149,800 |
| 2018 | $3,748 | $198,200 | $59,600 | $138,600 |
| 2017 | $3,613 | $188,000 | $59,600 | $128,400 |
| 2016 | $3,545 | $172,000 | $43,900 | $128,100 |
| 2015 | $3,452 | $172,000 | $43,900 | $128,100 |
| 2014 | $3,361 | $172,000 | $43,900 | $128,100 |
Source: Public Records
Map
Nearby Homes
- 30 Danielles Way
- 66 Eunice Ave
- 331 Burncoat St
- 323 Burncoat St
- 169 Whitmarsh Ave
- 39 Whitmarsh Ave
- 53 Collins St
- 13 Fatima Ln
- 58 Osceola Ave
- 15 Ericsson St
- 41 Mohave Rd
- 37 Mohave Rd
- 3205 Halcyon Dr Unit 3205
- 39 Mountainshire Dr
- 12 Erie Ave
- 44 Boardman St
- 10 Beale St
- 31 Danielles Way
- 120 Brattle St
- 69 Santoro Rd
Your Personal Tour Guide
Ask me questions while you tour the home.