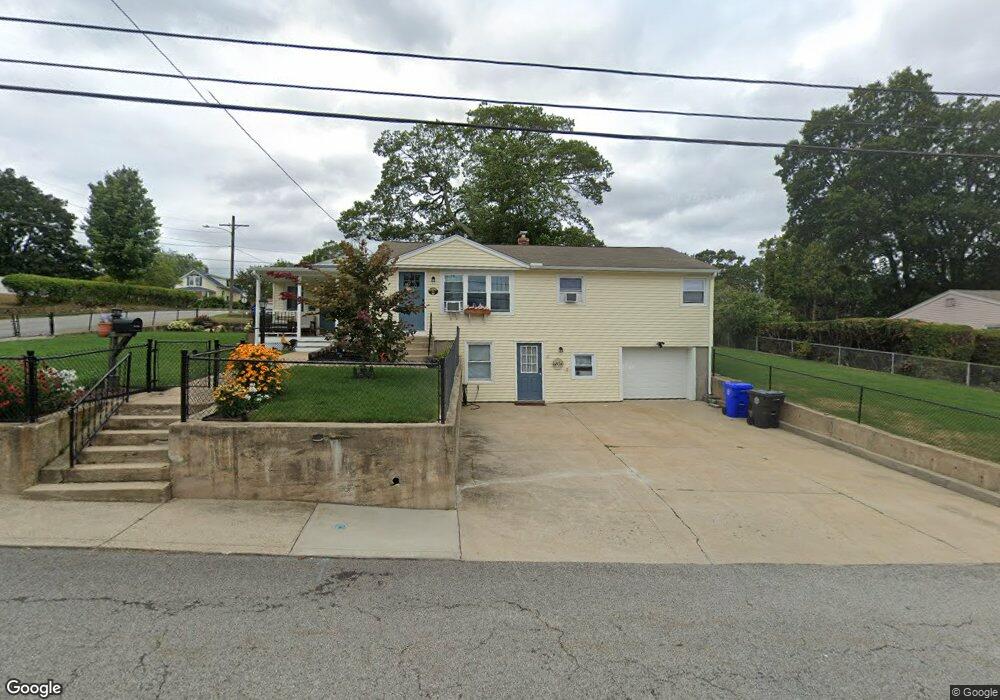
69 Revere Ave West Warwick, RI 02893
Centreville NeighborhoodEstimated Value: $333,000 - $420,000
3
Beds
3
Baths
1,236
Sq Ft
$302/Sq Ft
Est. Value
About This Home
This home is located at 69 Revere Ave, West Warwick, RI 02893 and is currently estimated at $373,242, approximately $301 per square foot. 69 Revere Ave is a home located in Kent County with nearby schools including West Warwick High School.
Ownership History
Date
Name
Owned For
Owner Type
Purchase Details
Closed on
Sep 1, 2022
Sold by
Mcallister Debra S
Bought by
Mcallister Joshua S
Current Estimated Value
Home Financials for this Owner
Home Financials are based on the most recent Mortgage that was taken out on this home.
Original Mortgage
$179,000
Outstanding Balance
$170,943
Interest Rate
5.54%
Mortgage Type
Purchase Money Mortgage
Estimated Equity
$202,299
Purchase Details
Closed on
Jan 12, 2016
Sold by
Skurka Milton J
Bought by
Milton J Skurka Ret and Skurka
Create a Home Valuation Report for This Property
The Home Valuation Report is an in-depth analysis detailing your home's value as well as a comparison with similar homes in the area
Home Values in the Area
Average Home Value in this Area
Purchase History
| Date | Buyer | Sale Price | Title Company |
|---|---|---|---|
| Mcallister Joshua S | $224,000 | None Available | |
| Mcallister Joshua S | $224,000 | None Available | |
| Milton J Skurka Ret | -- | -- |
Source: Public Records
Mortgage History
| Date | Status | Borrower | Loan Amount |
|---|---|---|---|
| Open | Mcallister Joshua S | $179,000 | |
| Closed | Mcallister Joshua S | $179,000 |
Source: Public Records
Tax History Compared to Growth
Tax History
| Year | Tax Paid | Tax Assessment Tax Assessment Total Assessment is a certain percentage of the fair market value that is determined by local assessors to be the total taxable value of land and additions on the property. | Land | Improvement |
|---|---|---|---|---|
| 2025 | $5,027 | $351,800 | $122,700 | $229,100 |
| 2024 | $4,738 | $253,500 | $82,100 | $171,400 |
| 2023 | $4,644 | $253,500 | $82,100 | $171,400 |
| 2022 | $4,761 | $263,900 | $82,100 | $181,800 |
| 2021 | $4,499 | $195,600 | $68,500 | $127,100 |
| 2020 | $4,499 | $195,600 | $68,500 | $127,100 |
| 2019 | $5,735 | $195,600 | $68,500 | $127,100 |
| 2018 | $4,109 | $155,600 | $71,200 | $84,400 |
| 2017 | $4,094 | $155,600 | $71,200 | $84,400 |
| 2016 | $4,021 | $155,600 | $71,200 | $84,400 |
| 2015 | $3,845 | $148,100 | $71,200 | $76,900 |
| 2014 | $3,760 | $148,100 | $71,200 | $76,900 |
Source: Public Records
Map
Nearby Homes
- 34 Buckley Ave
- 3 June Ct
- 38 New London Ave
- 16 Ontario St
- 64 Lockwood St
- 25 School St
- 94 Cowesett Ave Unit 8
- 170 Cowesett Ave
- 177 Cowesett Ave
- 1 Leona Ct
- 3 Leona Ct
- 52 Glen Dr
- 2 Teresa Ann Crossing
- 8 Teresa Ann Crossing
- 4 Teresa Ann Crossing
- 6 Teresa Ann Crossing
- 46 Trellis Dr
- 12 Earl St
- 54 Arthur St
- 33 Judy Terrace