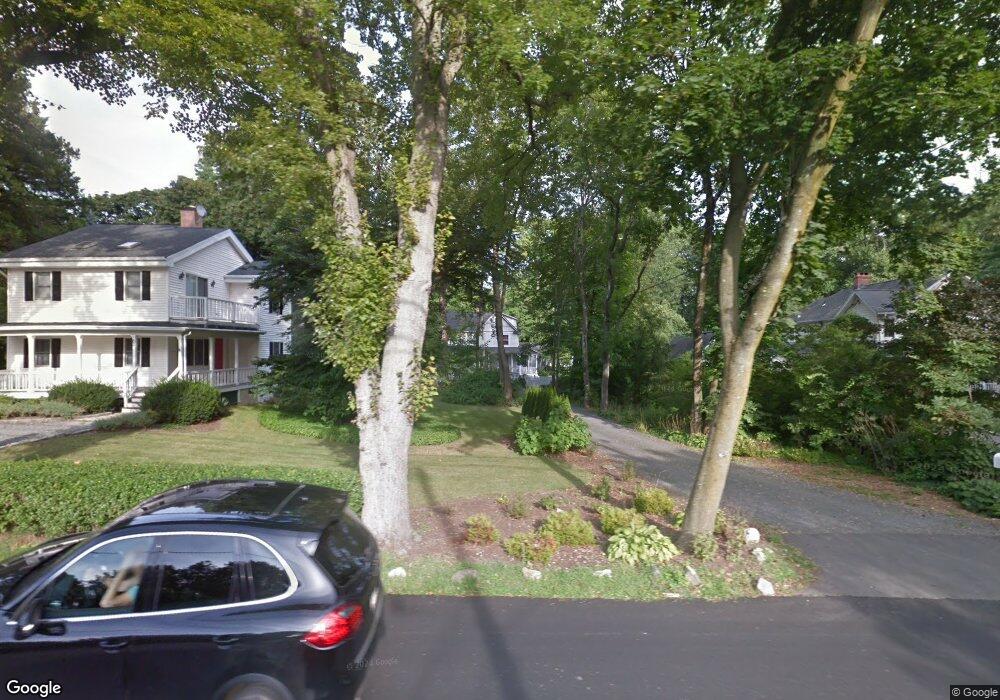
69 Riverside Ave Unit A Riverside, CT 06878
Estimated Value: $1,634,000 - $2,284,814
3
Beds
3
Baths
2,136
Sq Ft
$896/Sq Ft
Est. Value
About This Home
This home is located at 69 Riverside Ave Unit A, Riverside, CT 06878 and is currently estimated at $1,913,954, approximately $896 per square foot. 69 Riverside Ave Unit A is a home located in Fairfield County with nearby schools including Riverside School, Eastern Middle School, and Greenwich High School.
Ownership History
Date
Name
Owned For
Owner Type
Purchase Details
Closed on
Oct 25, 2016
Sold by
Flynn Michael and Flynn Sofia
Bought by
Gilbert Cynthia
Current Estimated Value
Purchase Details
Closed on
Nov 26, 2012
Sold by
Berzolla Catherine and Berzolla Mercanti-Anthony M
Bought by
Nicholas Ellen Llc
Purchase Details
Closed on
Mar 20, 2012
Sold by
Gilfond Megan
Bought by
Berzolla Catherine and Anthony Michael J M
Home Financials for this Owner
Home Financials are based on the most recent Mortgage that was taken out on this home.
Original Mortgage
$775,000
Interest Rate
3.86%
Mortgage Type
Stand Alone Refi Refinance Of Original Loan
Purchase Details
Closed on
Jul 12, 1999
Sold by
Mahon Alison T and Mahon John C
Bought by
Gilfond Santiago and Gilfond Megan
Purchase Details
Closed on
Feb 28, 1997
Sold by
Sherman Daria D
Bought by
Glaser Alison T and Mahon John C
Create a Home Valuation Report for This Property
The Home Valuation Report is an in-depth analysis detailing your home's value as well as a comparison with similar homes in the area
Home Values in the Area
Average Home Value in this Area
Purchase History
We collect this data history from publicly available records. To have your information removed, we recommend requesting removal directly through your county’s website.
| Date | Buyer | Sale Price | Title Company |
|---|---|---|---|
| Gilbert Cynthia | $859,000 | -- | |
| Nicholas Ellen Llc | -- | -- | |
| Berzolla Catherine | $1,200,000 | -- | |
| Gilfond Santiago | $750,000 | -- | |
| Glaser Alison T | $630,000 | -- |
Source: Public Records
Mortgage History
We collect this data history from publicly available records. To have your information removed, we recommend requesting removal directly through your county’s website.
| Date | Status | Borrower | Loan Amount |
|---|---|---|---|
| Previous Owner | Berzolla Catherine | $775,000 | |
| Previous Owner | Glaser Alison T | $500,000 | |
| Previous Owner | Glaser Alison T | $500,000 |
Source: Public Records
Tax History
| Year | Tax Paid | Tax Assessment Tax Assessment Total Assessment is a certain percentage of the fair market value that is determined by local assessors to be the total taxable value of land and additions on the property. | Land | Improvement |
|---|---|---|---|---|
| 2025 | $13,336 | $1,079,050 | $886,410 | $192,640 |
| 2024 | $12,880 | $1,079,050 | $886,410 | $192,640 |
| 2023 | $12,556 | $1,079,050 | $886,410 | $192,640 |
| 2022 | $12,441 | $1,079,050 | $886,410 | $192,640 |
| 2021 | $12,909 | $1,072,190 | $866,390 | $205,800 |
| 2020 | $12,888 | $1,072,190 | $866,390 | $205,800 |
| 2019 | $12,963 | $1,067,780 | $866,390 | $201,390 |
| 2018 | $13,208 | $1,067,780 | $866,390 | $201,390 |
| 2017 | $12,834 | $1,067,780 | $866,390 | $201,390 |
| 2016 | $12,631 | $1,067,780 | $866,390 | $201,390 |
| 2015 | $12,680 | $1,063,300 | $840,700 | $222,600 |
| 2014 | $12,361 | $1,063,300 | $840,700 | $222,600 |
Source: Public Records
Map
Nearby Homes
- 97 Riverside Ave
- 14 Bradbury Place
- 73 Lockwood Rd
- 29 Coventry Ln
- 1 Bramble Ln
- 21 Lake Dr
- 11 Hearthstone Dr
- 9 River Rd Unit 418
- 15 River Rd Unit 205
- 115 River Rd Unit 3
- 10 Newton St
- 32 Winthrop Dr
- 14 Spezzano Dr
- 7 River Rd Unit Boat Slip A-2
- 7 River Rd Unit Boat Slip E3
- 7 River Rd Unit Boat Slip H3
- 64 Summit Rd
- 14 Neil Ln
- 7 Indian Head Rd
- 56 Winthrop Dr
- 81 Riverside Ave
- 71 Riverside Ave
- 83 Riverside Ave
- 91 Riverside Ave
- 21 Lockwood Rd
- 69 Riverside Ave
- 17 Lockwood Rd
- 25 Lockwood Rd
- 15 Lockwood Rd
- 63 Riverside Ave
- 67 Riverside Ave
- 67 Riverside Ave Unit B
- 31 Lockwood Rd
- 1 Lockwood Rd
- 11 Lockwood Rd
- 72 Riverside Ave
- 68 Riverside Ave
- 27 Lockwood Rd
- 59 Riverside Ave
- 24 Lockwood Rd
Your Personal Tour Guide
Ask me questions while you tour the home.