Z
Landlord's Agent in 2013
Zachary Monroe
Copley Real Estate Group
6 Total Sales


Estimated Value: $1,866,000 - $2,252,000
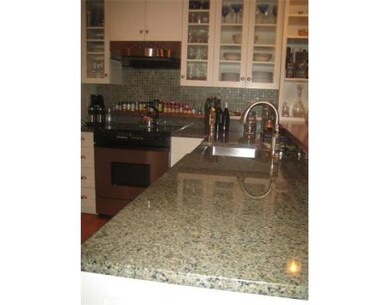
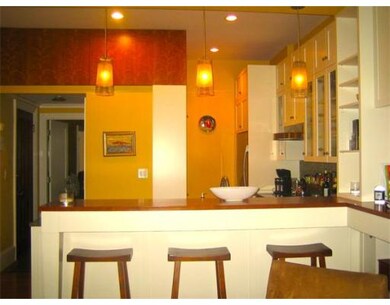
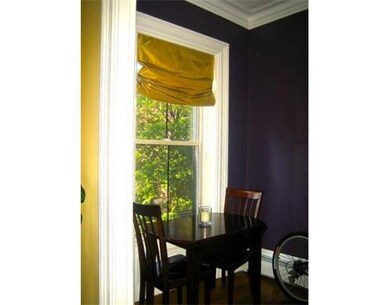
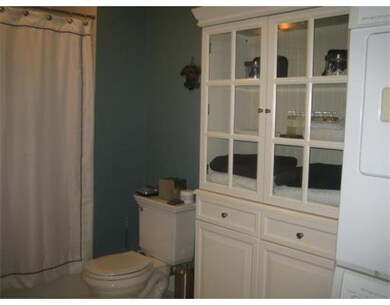
Lovely South End custom-designed condo on Rutland St. near the corner of Tremont St. One bedroom plus study! Entire 2nd floor of well-managed brownstone. Unit boasts high ceilings with crown molding, hardwood floors, working wood-burning fireplace, amazing open style kitchen with granite counters, stainless steel appliances, dishwasher/disposal, & breakfast bar w/stools. In-unit washer/dryer. Tons of storage space in-unit including customized closet systems. The perfect mix of charm, design and renovation make this the perfect home for a lucky renter! Available furnished for $2800 or unfurnished for $2900. Heat & hot water included.
Last Renter's Agent
Kim Jennings
Amo Realty - Boston City Properties
Home Type
Other
Est. Annual Taxes
$21,222
Year Built
1900
Lot Details
0
| Date | Buyer | Sale Price | Title Company |
|---|---|---|---|
| Tenhula John | $995,000 | -- | |
| Mccarthy Michael | $995,000 | -- |
| Date | Status | Borrower | Loan Amount |
|---|---|---|---|
| Open | Mccarthy Michael | $518,000 | |
| Closed | Mccarthy Michael | $523,000 | |
| Closed | Mccarthy Michael | $523,750 |
| Date | Event | Price | List to Sale | Price per Sq Ft |
|---|---|---|---|---|
| 10/07/2013 10/07/13 | Rented | $2,800 | 0.0% | -- |
| 10/07/2013 10/07/13 | For Rent | $2,800 | -- | -- |
| Year | Tax Paid | Tax Assessment Tax Assessment Total Assessment is a certain percentage of the fair market value that is determined by local assessors to be the total taxable value of land and additions on the property. | Land | Improvement |
|---|---|---|---|---|
| 2025 | $21,222 | $1,832,600 | $0 | $1,832,600 |
| 2024 | $19,386 | $1,778,500 | $0 | $1,778,500 |
| 2023 | $18,719 | $1,742,900 | $0 | $1,742,900 |
| 2022 | $18,779 | $1,726,000 | $0 | $1,726,000 |
| 2021 | $18,056 | $1,692,200 | $0 | $1,692,200 |
| 2020 | $16,841 | $1,594,800 | $0 | $1,594,800 |
| 2019 | $16,316 | $1,548,000 | $0 | $1,548,000 |
| 2018 | $15,298 | $1,459,700 | $0 | $1,459,700 |
| 2017 | $14,722 | $1,390,200 | $0 | $1,390,200 |
| 2016 | $14,705 | $1,336,800 | $0 | $1,336,800 |
| 2015 | $13,769 | $1,137,000 | $0 | $1,137,000 |
| 2014 | $12,981 | $1,031,900 | $0 | $1,031,900 |
Z
Landlord's Agent in 2013
Zachary Monroe
Copley Real Estate Group
6 Total Sales
K
Tenant's Agent in 2013
Kim Jennings
Amo Realty - Boston City Properties
Source: MLS Property Information Network (MLS PIN)
MLS Number: 71593469
APN: CBOS-000000-000009-000460-000006
Disclaimer: Certain information contained herein is derived from information provided by parties other than Homes.com. All information provided is deemed reliable, but is not guaranteed to be accurate and should be independently verified.
![]() The property listing data and information, or the Images, set forth herein were provided to MLS Property Information Network, Inc. from third party sources, including sellers, lessors and public records, and were compiled by MLS Property Information Network, Inc. The property listing data and information, and the Images, are for the personal, non-commercial use of consumers having a good faith interest in purchasing or leasing listed properties of the type displayed to them and may not be used for any purpose other than to identify prospective properties which such consumers may have a good faith interest in purchasing or leasing. MLS Property Information Network, Inc. and its subscribers disclaim any and all representations and warranties as to the accuracy of the property listing data and information, or as to the accuracy of any of the Images, set forth herein.
The property listing data and information, or the Images, set forth herein were provided to MLS Property Information Network, Inc. from third party sources, including sellers, lessors and public records, and were compiled by MLS Property Information Network, Inc. The property listing data and information, and the Images, are for the personal, non-commercial use of consumers having a good faith interest in purchasing or leasing listed properties of the type displayed to them and may not be used for any purpose other than to identify prospective properties which such consumers may have a good faith interest in purchasing or leasing. MLS Property Information Network, Inc. and its subscribers disclaim any and all representations and warranties as to the accuracy of the property listing data and information, or as to the accuracy of any of the Images, set forth herein.
