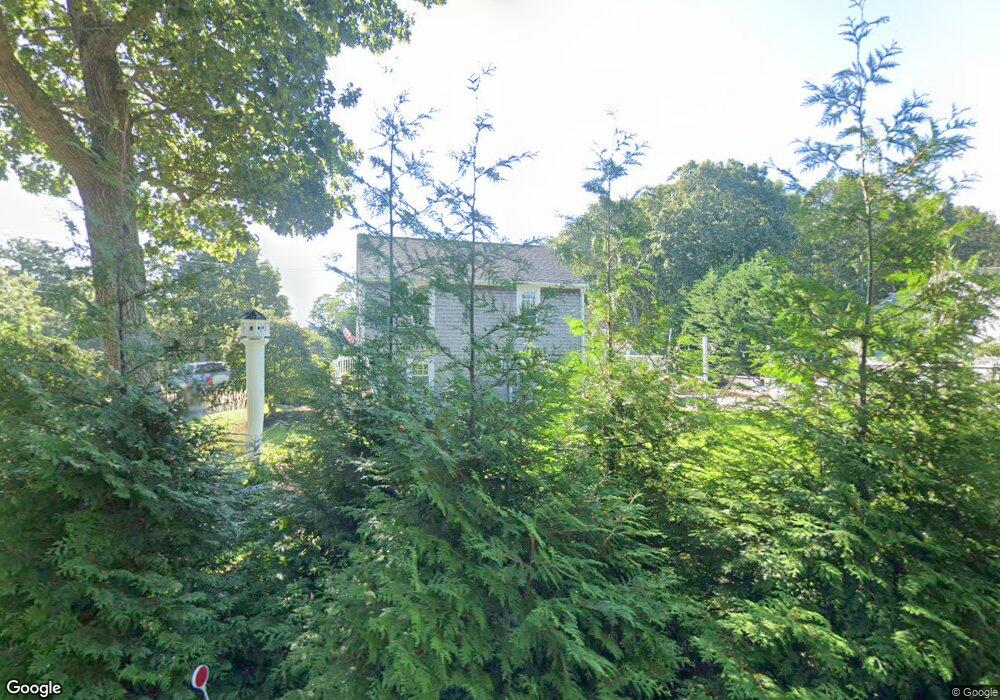
69 S West Dr Dennis, MA 02638
Dennis Village NeighborhoodEstimated Value: $826,005 - $951,000
5
Beds
2
Baths
2,645
Sq Ft
$345/Sq Ft
Est. Value
About This Home
This home is located at 69 S West Dr, Dennis, MA 02638 and is currently estimated at $913,251, approximately $345 per square foot. 69 S West Dr is a home located in Barnstable County with nearby schools including Dennis-Yarmouth Regional High School.
Ownership History
Date
Name
Owned For
Owner Type
Purchase Details
Closed on
Apr 15, 2025
Sold by
Vavrinec Richard F and Vavrinec Mary E
Bought by
Vavrinec Ft and Vavrinec
Current Estimated Value
Purchase Details
Closed on
May 22, 1980
Bought by
Vavrinec Richard F and Vavrinec Mary E
Create a Home Valuation Report for This Property
The Home Valuation Report is an in-depth analysis detailing your home's value as well as a comparison with similar homes in the area
Home Values in the Area
Average Home Value in this Area
Purchase History
| Date | Buyer | Sale Price | Title Company |
|---|---|---|---|
| Vavrinec Ft | -- | None Available | |
| Vavrinec Ft | -- | None Available | |
| Vavrinec Richard F | -- | -- |
Source: Public Records
Mortgage History
| Date | Status | Borrower | Loan Amount |
|---|---|---|---|
| Previous Owner | Vavrinec Richard F | $100,000 | |
| Previous Owner | Vavrinec Richard F | $75,000 |
Source: Public Records
Tax History Compared to Growth
Tax History
| Year | Tax Paid | Tax Assessment Tax Assessment Total Assessment is a certain percentage of the fair market value that is determined by local assessors to be the total taxable value of land and additions on the property. | Land | Improvement |
|---|---|---|---|---|
| 2025 | $2,967 | $685,200 | $139,000 | $546,200 |
| 2024 | $3,005 | $684,500 | $140,000 | $544,500 |
| 2023 | $2,987 | $639,600 | $144,600 | $495,000 |
| 2022 | $2,648 | $472,900 | $130,300 | $342,600 |
| 2021 | $2,567 | $425,700 | $112,400 | $313,300 |
| 2020 | $2,270 | $372,200 | $112,400 | $259,800 |
| 2019 | $2,354 | $381,600 | $120,200 | $261,400 |
| 2018 | $2,373 | $374,300 | $124,000 | $250,300 |
| 2017 | $2,302 | $374,300 | $124,000 | $250,300 |
| 2016 | $2,277 | $348,700 | $133,500 | $215,200 |
| 2015 | $2,232 | $348,700 | $133,500 | $215,200 |
| 2014 | $2,214 | $348,700 | $133,500 | $215,200 |
Source: Public Records
Map
Nearby Homes
- 268 Main St
- 59 Main St Unit 19-2
- 59 Route 6a Unit 29-4
- 6 Thomas Ct
- 59 Massachusetts 6a Unit 19-2
- 15 Signal Hill Dr
- 51 Bray Farm Rd N
- 35 Crown Grant Dr
- 645 Main St Back Lot
- 6 Nimble Hill Dr
- 13 Covey Dr
- 50 John Hall Cartway
- 50 John Hall Cartway Unit 50
- 19 Deacon Joseph Ln
- 19 Whig St
- 64 Kates Path
- 831 Main St
- 59 Hope Ln
- 228 Kates Path
- 44 Stratford Ln