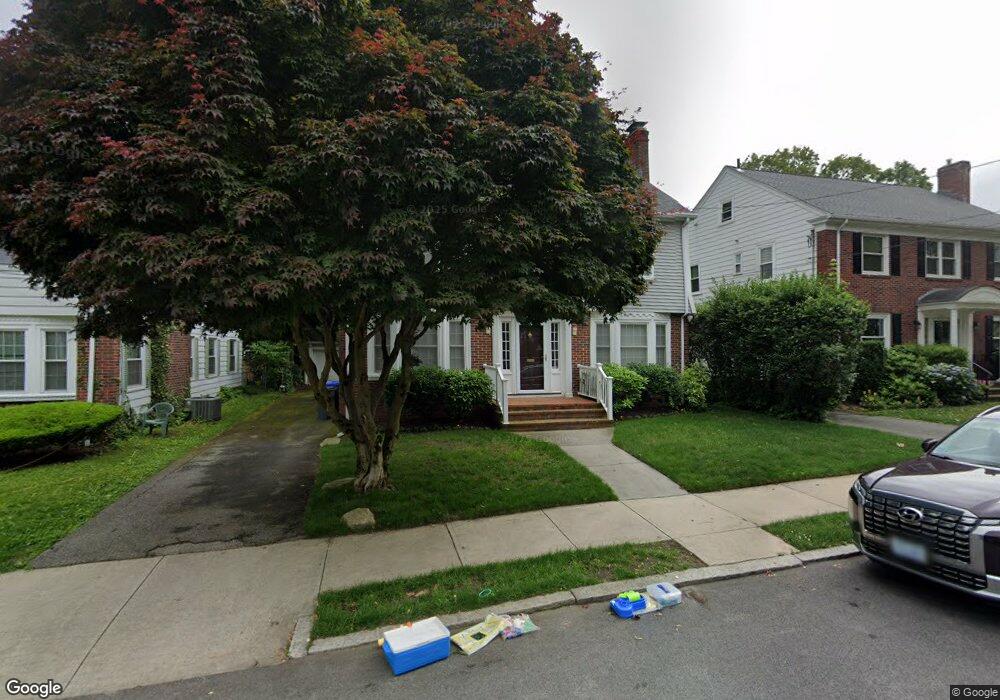
69 Sargent Ave Providence, RI 02906
Blackstone NeighborhoodEstimated Value: $842,000 - $1,138,000
5
Beds
3
Baths
2,983
Sq Ft
$339/Sq Ft
Est. Value
About This Home
This home is located at 69 Sargent Ave, Providence, RI 02906 and is currently estimated at $1,012,577, approximately $339 per square foot. 69 Sargent Ave is a home located in Providence County with nearby schools including Asa Messer Elementary School, Charles N. Fortes Elementary School, and Veazie Street Elementary School.
Ownership History
Date
Name
Owned For
Owner Type
Purchase Details
Closed on
Jun 24, 2003
Sold by
Nissel Matthew W and Nissel Yehudis S
Bought by
Scheinerman Peretz and Scheinerman Celia
Current Estimated Value
Purchase Details
Closed on
May 19, 1998
Sold by
Staiman Marshall C and Staiman Kelley
Bought by
Nissel Matthew W and Nissel Yehudis S
Purchase Details
Closed on
Mar 19, 1997
Sold by
Gladstone Tr Bruce W
Bought by
Staiman Marshall C and Staiman Kelley
Create a Home Valuation Report for This Property
The Home Valuation Report is an in-depth analysis detailing your home's value as well as a comparison with similar homes in the area
Home Values in the Area
Average Home Value in this Area
Purchase History
| Date | Buyer | Sale Price | Title Company |
|---|---|---|---|
| Scheinerman Peretz | $357,000 | -- | |
| Nissel Matthew W | $187,500 | -- | |
| Staiman Marshall C | $165,000 | -- |
Source: Public Records
Mortgage History
| Date | Status | Borrower | Loan Amount |
|---|---|---|---|
| Open | Staiman Marshall C | $417,000 | |
| Closed | Staiman Marshall C | $225,000 |
Source: Public Records
Tax History Compared to Growth
Tax History
| Year | Tax Paid | Tax Assessment Tax Assessment Total Assessment is a certain percentage of the fair market value that is determined by local assessors to be the total taxable value of land and additions on the property. | Land | Improvement |
|---|---|---|---|---|
| 2025 | $7,796 | $928,100 | $486,700 | $441,400 |
| 2024 | $13,660 | $744,400 | $308,200 | $436,200 |
| 2023 | $13,660 | $744,400 | $308,200 | $436,200 |
| 2022 | $13,250 | $744,400 | $308,200 | $436,200 |
| 2021 | $13,913 | $566,500 | $235,600 | $330,900 |
| 2020 | $13,913 | $566,500 | $235,600 | $330,900 |
| 2019 | $13,913 | $566,500 | $235,600 | $330,900 |
| 2018 | $16,411 | $513,500 | $220,100 | $293,400 |
| 2017 | $16,411 | $513,500 | $220,100 | $293,400 |
| 2016 | $16,411 | $513,500 | $220,100 | $293,400 |
| 2015 | $14,101 | $426,000 | $205,400 | $220,600 |
| 2014 | $14,378 | $426,000 | $205,400 | $220,600 |
| 2013 | $14,378 | $426,000 | $205,400 | $220,600 |
Source: Public Records
Map
Nearby Homes
- 57 Faunce Dr
- 509 Morris Ave Unit 3
- 5 Barbour Dr
- 69 Taft Ave
- 294 Cole Ave
- 360 Taber Ave
- 61 Sessions St
- 41 Stadium Rd
- 15 Goldsmith St
- 202 Rochambeau Ave Unit 2
- 23 Elmway St
- 166 Lancaster St
- 290 Blackstone Blvd
- 94 Larch St
- 640 Elmgrove Ave
- 167 Emeline St Unit 3
- 146 Evergreen St
- 436 Blackstone Blvd
- 114 Lorimer Ave
- 125 Evergreen St