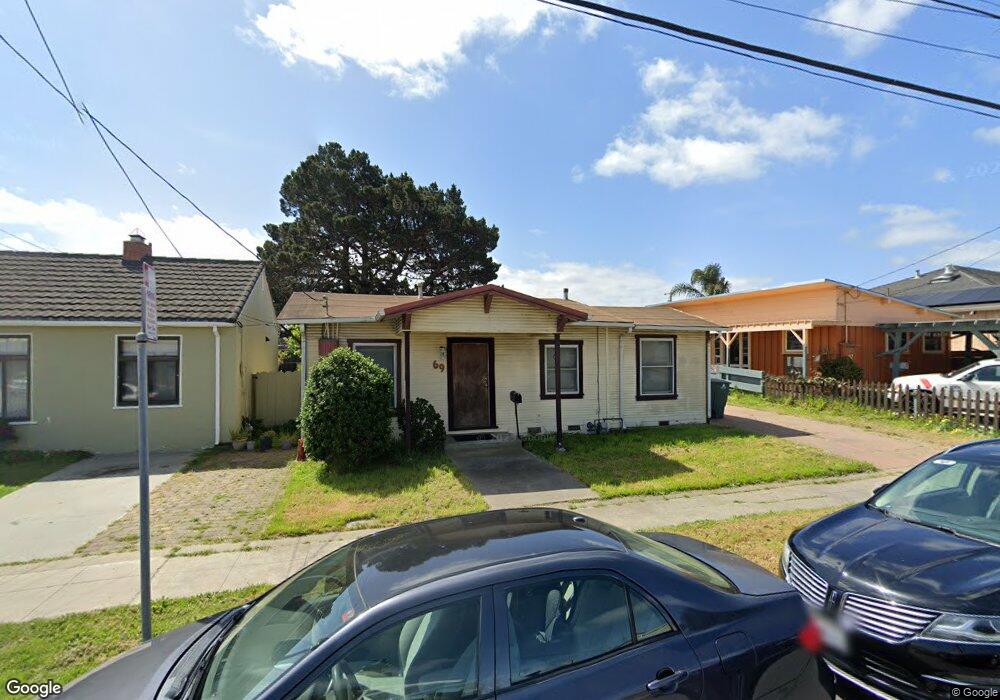
69 Scott St San Bruno, CA 94066
San Bruno Park NeighborhoodEstimated Value: $449,757 - $844,000
1
Bed
1
Bath
870
Sq Ft
$681/Sq Ft
Est. Value
About This Home
This home is located at 69 Scott St, San Bruno, CA 94066 and is currently estimated at $592,439, approximately $680 per square foot. 69 Scott St is a home located in San Mateo County with nearby schools including Belle Air Elementary School, Parkside Intermediate School, and Capuchino High School.
Ownership History
Date
Name
Owned For
Owner Type
Purchase Details
Closed on
Nov 22, 2024
Current Estimated Value
Purchase Details
Closed on
Aug 16, 2024
Purchase Details
Closed on
Mar 10, 2010
Purchase Details
Closed on
Jan 17, 2002
Home Financials for this Owner
Home Financials are based on the most recent Mortgage that was taken out on this home.
Original Mortgage
$137,000
Interest Rate
6.59%
Purchase Details
Closed on
Nov 21, 2001
Home Financials for this Owner
Home Financials are based on the most recent Mortgage that was taken out on this home.
Original Mortgage
$137,000
Interest Rate
6.59%
Create a Home Valuation Report for This Property
The Home Valuation Report is an in-depth analysis detailing your home's value as well as a comparison with similar homes in the area
Home Values in the Area
Average Home Value in this Area
Purchase History
| Date | Buyer | Sale Price | Title Company |
|---|---|---|---|
| -- | $435,000 | Accommodation/Courtesy Recordi | |
| -- | $435,000 | Accommodation/Courtesy Recordi | |
| -- | -- | None Listed On Document | |
| -- | -- | None Available | |
| -- | -- | Fidelity National Title | |
| -- | -- | Fidelity National Title Co |
Source: Public Records
Mortgage History
| Date | Status | Borrower | Loan Amount |
|---|---|---|---|
| Previous Owner | -- | $137,000 |
Source: Public Records
Tax History Compared to Growth
Tax History
| Year | Tax Paid | Tax Assessment Tax Assessment Total Assessment is a certain percentage of the fair market value that is determined by local assessors to be the total taxable value of land and additions on the property. | Land | Improvement |
|---|---|---|---|---|
| 2025 | $4,079 | $344,008 | $172,004 | $172,004 |
| 2023 | $4,079 | $330,652 | $165,326 | $165,326 |
| 2022 | $3,583 | $324,170 | $162,085 | $162,085 |
| 2021 | $3,535 | $317,814 | $158,907 | $158,907 |
| 2020 | $3,502 | $314,556 | $157,278 | $157,278 |
| 2019 | $3,444 | $308,390 | $154,195 | $154,195 |
| 2018 | $3,274 | $302,344 | $151,172 | $151,172 |
| 2017 | $3,238 | $296,416 | $148,208 | $148,208 |
| 2016 | $3,164 | $290,604 | $145,302 | $145,302 |
| 2015 | $3,122 | $286,240 | $143,120 | $143,120 |
| 2014 | $3,075 | $280,634 | $140,317 | $140,317 |
Source: Public Records
Map
Nearby Homes
- 56 Scott St
- 69 Atlantic Ave
- 1078 Montgomery Ave
- 917 Mills Ave
- 871 Green Ave
- 873 7th Ave
- 111 Rockwood Dr
- 774 Acacia Ave
- 214 Manor Dr
- 577 5th Ave
- 103 Piccadilly Place Unit A
- 1031 Cherry Ave Unit 33
- 123 Piccadilly Place Unit F
- 752 Cherry Ave
- 408 Boardwalk Ave Unit 1
- 498 Elm Ave
- 413 Piccadilly Place Unit 13
- 20 Maple Ave
- 241 Terrace Ave
- 322 Commercial Ave