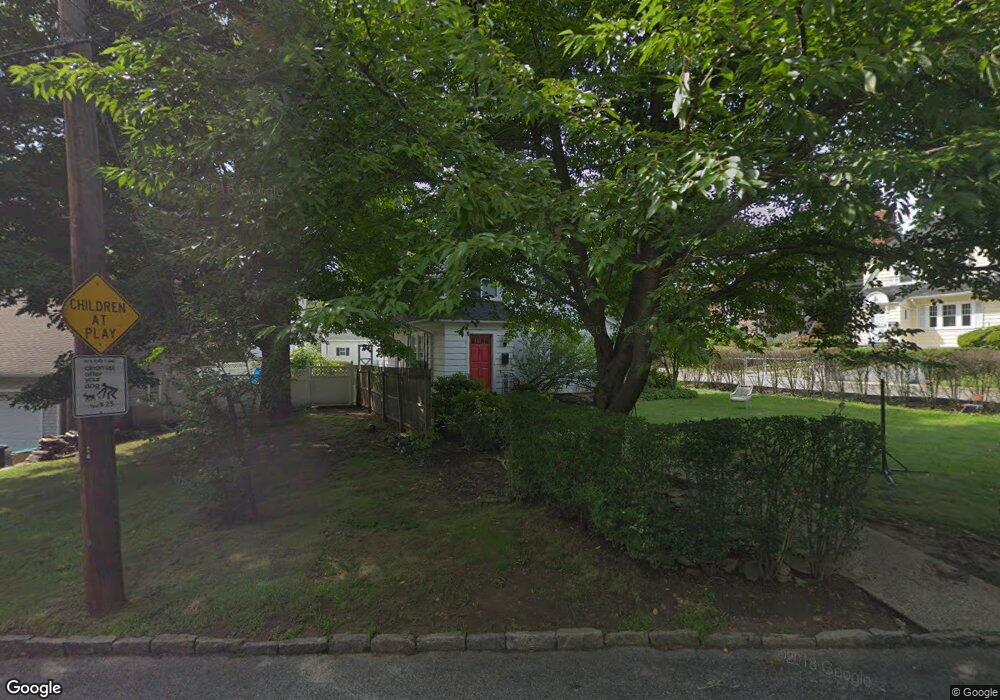
69 Shady Ln Dobbs Ferry, NY 10522
Estimated Value: $870,819 - $998,000
5
Beds
2
Baths
1,608
Sq Ft
$586/Sq Ft
Est. Value
About This Home
This home is located at 69 Shady Ln, Dobbs Ferry, NY 10522 and is currently estimated at $941,705, approximately $585 per square foot. 69 Shady Ln is a home located in Westchester County with nearby schools including Springhurst Elementary School, Dobbs Ferry High School, and The Masters School.
Ownership History
Date
Name
Owned For
Owner Type
Purchase Details
Closed on
Feb 15, 2002
Sold by
Gardner Gerald James and Gardner Stephanie Tutera
Bought by
Kimerling Joshua and Kimerling Andrea
Current Estimated Value
Home Financials for this Owner
Home Financials are based on the most recent Mortgage that was taken out on this home.
Original Mortgage
$265,000
Interest Rate
6.84%
Mortgage Type
Purchase Money Mortgage
Purchase Details
Closed on
Apr 13, 2001
Sold by
Godsey Mark A and Godsey Kristin D
Bought by
Gardner Gerald James and Gardner Stephanie Tutera
Home Financials for this Owner
Home Financials are based on the most recent Mortgage that was taken out on this home.
Original Mortgage
$363,375
Interest Rate
7.25%
Mortgage Type
Purchase Money Mortgage
Purchase Details
Closed on
Mar 18, 1998
Sold by
Pugh Thomas and Pugh Grace A
Bought by
Godsey Mark A and Godsey Kristin
Create a Home Valuation Report for This Property
The Home Valuation Report is an in-depth analysis detailing your home's value as well as a comparison with similar homes in the area
Home Values in the Area
Average Home Value in this Area
Purchase History
| Date | Buyer | Sale Price | Title Company |
|---|---|---|---|
| Kimerling Joshua | $440,000 | -- | |
| Gardner Gerald James | $427,500 | -- | |
| Godsey Mark A | $284,000 | Stewart Title Insurance Co |
Source: Public Records
Mortgage History
| Date | Status | Borrower | Loan Amount |
|---|---|---|---|
| Previous Owner | Kimerling Joshua | $265,000 | |
| Previous Owner | Gardner Gerald James | $363,375 |
Source: Public Records
Tax History Compared to Growth
Tax History
| Year | Tax Paid | Tax Assessment Tax Assessment Total Assessment is a certain percentage of the fair market value that is determined by local assessors to be the total taxable value of land and additions on the property. | Land | Improvement |
|---|---|---|---|---|
| 2024 | $21,015 | $684,500 | $331,300 | $353,200 |
| 2023 | $20,328 | $673,500 | $315,500 | $358,000 |
| 2022 | $19,600 | $643,700 | $315,500 | $328,200 |
| 2021 | $20,051 | $596,000 | $315,500 | $280,500 |
| 2020 | $19,698 | $589,600 | $315,500 | $274,100 |
| 2019 | $19,005 | $589,600 | $315,500 | $274,100 |
| 2018 | $20,359 | $573,700 | $315,500 | $258,200 |
| 2017 | $2,403 | $552,500 | $315,500 | $237,000 |
| 2016 | $435,616 | $531,200 | $315,500 | $215,700 |
| 2015 | -- | $15,300 | $1,500 | $13,800 |
| 2014 | -- | $15,300 | $1,500 | $13,800 |
| 2013 | $10,529 | $15,300 | $1,500 | $13,800 |
Source: Public Records
Map
Nearby Homes
- 0 Ashford Ave Unit KEY885130
- 0 Lyman Place Unit KEY923539
- 5 Forkland Ln
- 70 Washington Ave
- 101 Beacon Hill Dr Unit 13
- 17 Manor House Dr Unit K13
- 14 Manor House Dr Unit G29
- 40 Northfield Ave
- 13 English Ln Unit B
- 1402 Hunters Run
- 0 Sherman Ave Unit KEY841006
- 164 Washington Ave
- 801 Hunters Run
- 63 Grandview Ave
- 26 Round Hill Rd
- 118 Round Hill Rd
- 9 Round Hill Rd
- 110 Round Hill Rd Unit 77
- 1001 Hunters Run
- 50 Belden Ave