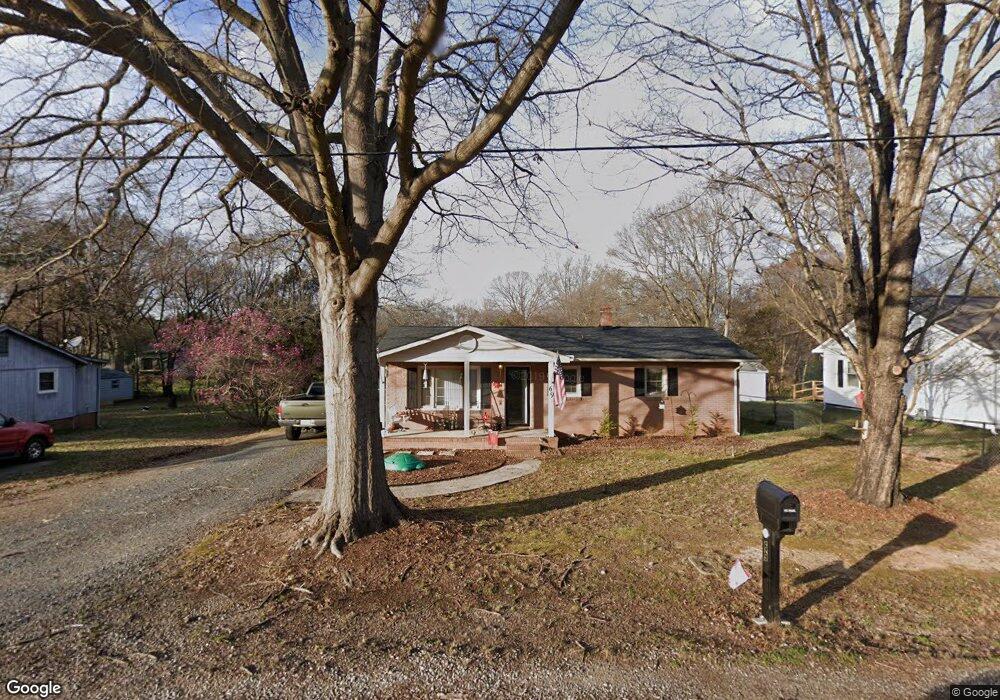
69 Stonecrest Cir SW Concord, NC 28027
Estimated Value: $202,000 - $232,000
2
Beds
1
Bath
939
Sq Ft
$233/Sq Ft
Est. Value
About This Home
This home is located at 69 Stonecrest Cir SW, Concord, NC 28027 and is currently estimated at $219,252, approximately $233 per square foot. 69 Stonecrest Cir SW is a home located in Cabarrus County with nearby schools including Wolf Meadow Elementary School, J.N. Fries Middle School, and Branch Christian Academy.
Ownership History
Date
Name
Owned For
Owner Type
Purchase Details
Closed on
Jul 1, 2016
Sold by
Hall Brandon Ryan and Blenzler Erin L
Bought by
Helms Mark and Helms Mary Elizabeth
Current Estimated Value
Home Financials for this Owner
Home Financials are based on the most recent Mortgage that was taken out on this home.
Original Mortgage
$96,500
Outstanding Balance
$78,656
Interest Rate
4.25%
Mortgage Type
Adjustable Rate Mortgage/ARM
Estimated Equity
$140,596
Purchase Details
Closed on
Oct 10, 2006
Sold by
Snavely Richard E and Snavely Norma L
Bought by
Hall Brandon Ryan
Home Financials for this Owner
Home Financials are based on the most recent Mortgage that was taken out on this home.
Original Mortgage
$90,000
Interest Rate
6.25%
Mortgage Type
Purchase Money Mortgage
Purchase Details
Closed on
Apr 17, 1998
Sold by
Love Loyd S & Sheri N
Bought by
Snavely Richard E and Snavely Norma L
Purchase Details
Closed on
Jul 1, 1994
Create a Home Valuation Report for This Property
The Home Valuation Report is an in-depth analysis detailing your home's value as well as a comparison with similar homes in the area
Home Values in the Area
Average Home Value in this Area
Purchase History
| Date | Buyer | Sale Price | Title Company |
|---|---|---|---|
| Helms Mark | $96,500 | None Available | |
| Hall Brandon Ryan | $90,000 | None Available | |
| Snavely Richard E | $67,500 | -- | |
| -- | $57,000 | -- |
Source: Public Records
Mortgage History
| Date | Status | Borrower | Loan Amount |
|---|---|---|---|
| Open | Helms Mark | $96,500 | |
| Previous Owner | Hall Brandon Ryan | $90,000 |
Source: Public Records
Tax History Compared to Growth
Tax History
| Year | Tax Paid | Tax Assessment Tax Assessment Total Assessment is a certain percentage of the fair market value that is determined by local assessors to be the total taxable value of land and additions on the property. | Land | Improvement |
|---|---|---|---|---|
| 2025 | $1,817 | $182,470 | $47,500 | $134,970 |
| 2024 | $1,817 | $182,470 | $47,500 | $134,970 |
| 2023 | $1,247 | $102,230 | $28,500 | $73,730 |
| 2022 | $1,247 | $102,230 | $28,500 | $73,730 |
| 2021 | $1,247 | $102,230 | $28,500 | $73,730 |
| 2020 | $1,247 | $102,230 | $28,500 | $73,730 |
| 2019 | $1,025 | $84,050 | $20,900 | $63,150 |
| 2018 | $1,009 | $84,050 | $20,900 | $63,150 |
| 2017 | $992 | $84,050 | $20,900 | $63,150 |
| 2016 | $588 | $81,550 | $20,900 | $60,650 |
| 2015 | $962 | $81,550 | $20,900 | $60,650 |
| 2014 | $962 | $81,550 | $20,900 | $60,650 |
Source: Public Records
Map
Nearby Homes
- 1255 Old Charlotte Rd
- 668 Jackson Terrace SW
- 664 Jackson Terrace SW
- 1067 Old Charlotte Rd
- 609 Faith Dr SW Unit 1
- 2824 Trestle Ct SW
- Lot #2 Faith Dr SW
- 518 Viking Place SW
- 2893 Signal Ct SW
- 84 Highland Ave SW
- 82 Highland Ave SW
- 809 Fargo Dr SW
- 493 Debra Cir SW
- 933 Old Charlotte Rd
- 782 Chalice St SW
- 3168 Sossamon Place
- 758 Main St SW
- 3073 Champion Ln SW
- 207 Highland Ave SW
- 1022 Van Gogh Dr SW
- 67 Stonecrest Cir SW
- 71 Stonecrest Cir SW
- 16 Barbee Rd SW
- 63 Stonecrest Cir SW
- 14 Barbee Rd SW
- 18 Barbee Rd SW
- 75 Stonecrest Cir SW
- 70 Stonecrest Cir SW
- 61 Stonecrest Cir SW
- 74 Stonecrest Cir SW
- 22 Barbee Rd SW
- 79 Stonecrest Cir SW
- 10 Barbee Rd SW
- 10 Barbee Rd SW Unit 3
- 24 Barbee Rd SW
- 78 Stonecrest Cir SW
- 00 Barbee Rd SW
- 83 Stonecrest Cir SW
- 1281 Old Charlotte Rd
- 82 Stonecrest Cir SW