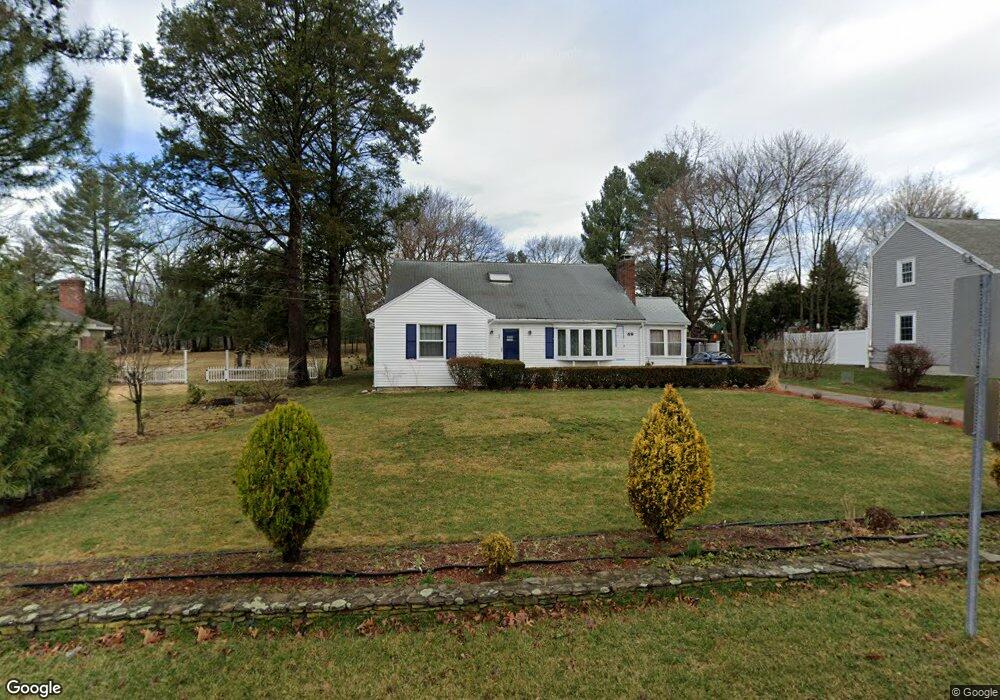
69 Summer St Framingham, MA 01701
Estimated Value: $667,000 - $728,000
4
Beds
2
Baths
1,756
Sq Ft
$398/Sq Ft
Est. Value
About This Home
This home is located at 69 Summer St, Framingham, MA 01701 and is currently estimated at $699,193, approximately $398 per square foot. 69 Summer St is a home located in Middlesex County with nearby schools including Framingham High School, Christa McAuliffe Charter School, and Happy Hollow School.
Ownership History
Date
Name
Owned For
Owner Type
Purchase Details
Closed on
Aug 1, 2001
Sold by
Weinberg Mark and Weinberg Liudmila
Bought by
Barry Patricia E
Current Estimated Value
Home Financials for this Owner
Home Financials are based on the most recent Mortgage that was taken out on this home.
Original Mortgage
$49,950
Outstanding Balance
$18,297
Interest Rate
7.1%
Mortgage Type
Purchase Money Mortgage
Estimated Equity
$680,896
Purchase Details
Closed on
Jan 14, 1987
Sold by
Caruso Joseph M
Bought by
Nilssen Andrew H
Create a Home Valuation Report for This Property
The Home Valuation Report is an in-depth analysis detailing your home's value as well as a comparison with similar homes in the area
Home Values in the Area
Average Home Value in this Area
Purchase History
| Date | Buyer | Sale Price | Title Company |
|---|---|---|---|
| Barry Patricia E | $22,000 | -- | |
| Nilssen Andrew H | $149,000 | -- |
Source: Public Records
Mortgage History
| Date | Status | Borrower | Loan Amount |
|---|---|---|---|
| Open | Nilssen Andrew H | $49,950 | |
| Previous Owner | Nilssen Andrew H | $50,000 | |
| Previous Owner | Nilssen Andrew H | $24,800 |
Source: Public Records
Tax History
| Year | Tax Paid | Tax Assessment Tax Assessment Total Assessment is a certain percentage of the fair market value that is determined by local assessors to be the total taxable value of land and additions on the property. | Land | Improvement |
|---|---|---|---|---|
| 2025 | $6,981 | $584,700 | $270,400 | $314,300 |
| 2024 | $6,900 | $553,800 | $241,500 | $312,300 |
| 2023 | $6,538 | $499,500 | $215,600 | $283,900 |
| 2022 | $6,221 | $452,800 | $195,600 | $257,200 |
| 2021 | $6,013 | $428,000 | $188,000 | $240,000 |
| 2020 | $6,046 | $403,600 | $170,900 | $232,700 |
| 2019 | $5,872 | $381,800 | $170,900 | $210,900 |
| 2018 | $5,736 | $351,500 | $164,500 | $187,000 |
| 2017 | $5,610 | $335,700 | $159,700 | $176,000 |
| 2016 | $5,409 | $311,200 | $159,700 | $151,500 |
| 2015 | $5,387 | $302,300 | $160,500 | $141,800 |
Source: Public Records
Map
Nearby Homes
- 7 Ballydrain Rd
- 8 Emily Rd
- 108 Cherry St
- 30 Donlon St
- 342 Old Connecticut Path
- Lot 3 Murray Hill Rd
- 14 Ridgefield Dr
- 56 Greenleaf Cir
- 35 Gleason St
- 6 Woodward Rd
- 447 Old Connecticut Path
- 356 Central St
- 231 Central St
- 30 A St
- 46 Cochituate Rd Unit 106
- 689 Old Connecticut Path
- 62 Central St
- 11 Danforth Park Rd
- 227 Water St
- 19 Park Ave
Your Personal Tour Guide
Ask me questions while you tour the home.