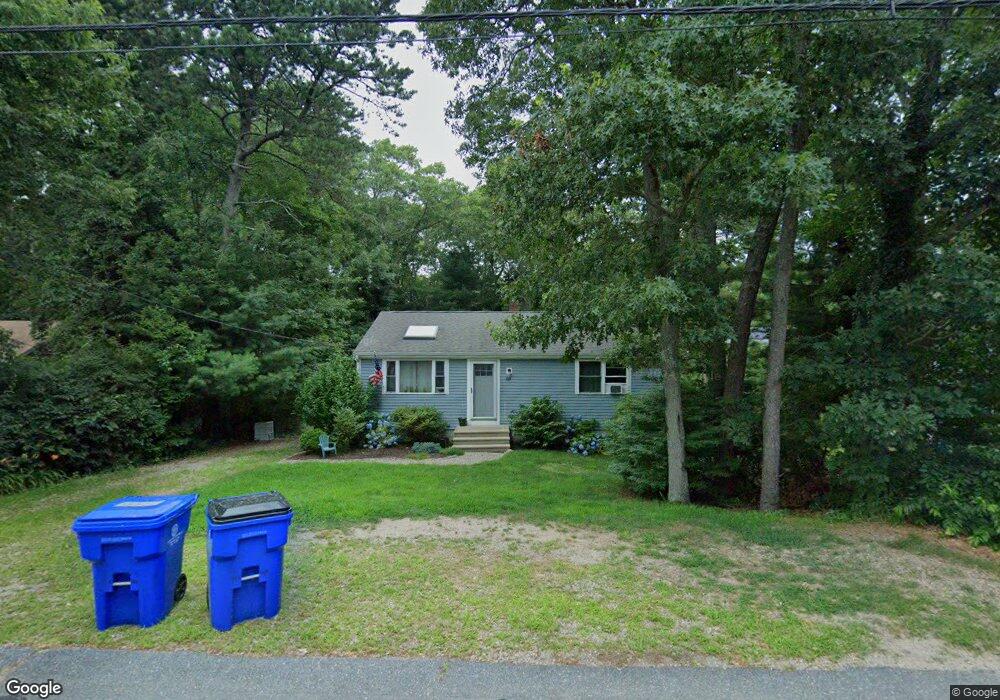
69 Thom Ave Buzzards Bay, MA 02532
Monument Beach NeighborhoodEstimated Value: $447,191 - $560,000
2
Beds
1
Bath
864
Sq Ft
$578/Sq Ft
Est. Value
About This Home
This home is located at 69 Thom Ave, Buzzards Bay, MA 02532 and is currently estimated at $499,548, approximately $578 per square foot. 69 Thom Ave is a home located in Barnstable County with nearby schools including Bourne High School, Cadence Academy Preschool - Bourne, and St Margaret Regional School.
Ownership History
Date
Name
Owned For
Owner Type
Purchase Details
Closed on
Feb 13, 2018
Sold by
Collins Jacob A and Collins Michele
Bought by
Collins J Andrew
Current Estimated Value
Purchase Details
Closed on
Jun 1, 2007
Sold by
Gene H Nasif Ft and Olsen
Bought by
Collins Jacob A and Collins Michele
Home Financials for this Owner
Home Financials are based on the most recent Mortgage that was taken out on this home.
Original Mortgage
$247,000
Interest Rate
6.24%
Mortgage Type
Purchase Money Mortgage
Purchase Details
Closed on
Mar 2, 1990
Sold by
Goldstein Scott
Bought by
The Gene H Nasif Ft
Create a Home Valuation Report for This Property
The Home Valuation Report is an in-depth analysis detailing your home's value as well as a comparison with similar homes in the area
Home Values in the Area
Average Home Value in this Area
Purchase History
| Date | Buyer | Sale Price | Title Company |
|---|---|---|---|
| Collins J Andrew | -- | -- | |
| Collins J Andrew | -- | -- | |
| Collins Jacob A | $247,000 | -- | |
| Collins Jacob A | $247,000 | -- | |
| The Gene H Nasif Ft | $122,000 | -- | |
| The Gene H Nasif Ft | $122,000 | -- |
Source: Public Records
Mortgage History
| Date | Status | Borrower | Loan Amount |
|---|---|---|---|
| Previous Owner | Collins Jacob A | $247,000 |
Source: Public Records
Tax History
| Year | Tax Paid | Tax Assessment Tax Assessment Total Assessment is a certain percentage of the fair market value that is determined by local assessors to be the total taxable value of land and additions on the property. | Land | Improvement |
|---|---|---|---|---|
| 2025 | $2,836 | $363,100 | $188,800 | $174,300 |
| 2024 | $2,790 | $347,900 | $179,800 | $168,100 |
| 2023 | $2,713 | $307,900 | $159,100 | $148,800 |
| 2022 | $2,612 | $258,900 | $140,800 | $118,100 |
| 2021 | $2,537 | $235,600 | $128,100 | $107,500 |
| 2020 | $2,456 | $228,700 | $126,900 | $101,800 |
| 2019 | $9,565 | $223,000 | $126,900 | $96,100 |
| 2018 | $2,129 | $202,000 | $115,100 | $86,900 |
| 2017 | $1,969 | $191,200 | $114,000 | $77,200 |
| 2016 | $1,927 | $189,700 | $114,000 | $75,700 |
| 2015 | $1,910 | $189,700 | $114,000 | $75,700 |
Source: Public Records
Map
Nearby Homes
- 20 Colony Ave
- 4 Harbor Hill Dr
- 16 Amberwood Ct
- 203 County Rd
- 12 Turnberry Rd Unit 12
- 566 Shore Rd
- 4 Hollyhock Knoll Ct Unit 4
- 4 Hollyhock Knoll Ct Unit 4
- 2 Applewood Ct
- 13 Laurel Hill Ct
- 5 Sea Knoll Ct
- 3 1st St
- 709 County Rd
- 5 Zoli Ln
- 3 4th Ave
- 7 4th Ave
- 14 Navajo Rd
- 254 Barlows Landing Rd
- 44 Cotuit Rd
- 16 Michael Rd
Your Personal Tour Guide
Ask me questions while you tour the home.