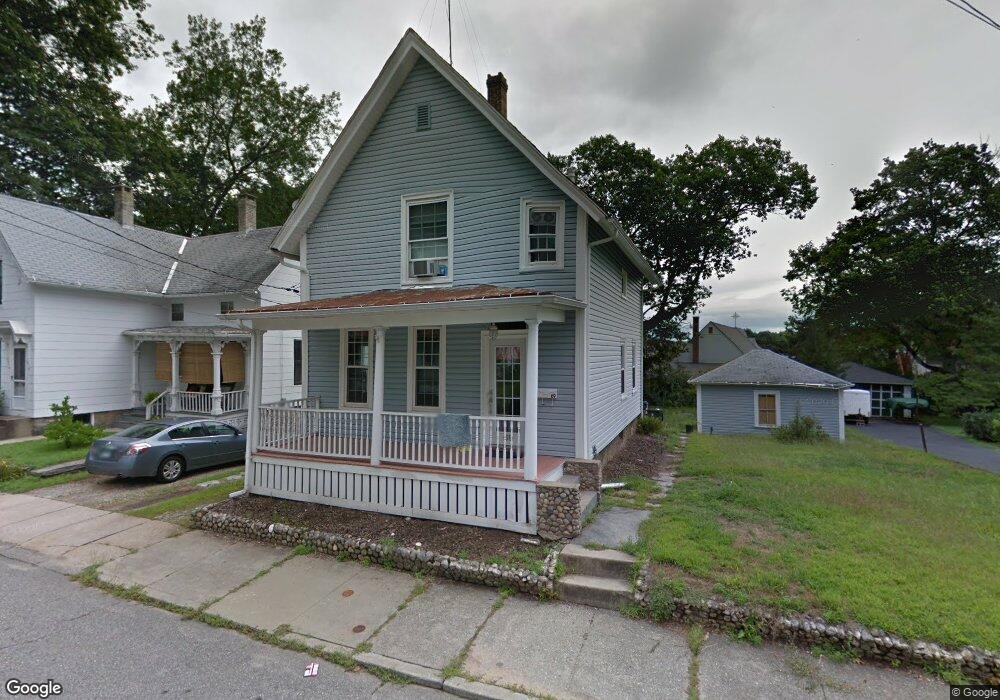
69 Turner St Willimantic, CT 06226
Estimated Value: $237,000 - $271,000
3
Beds
1
Bath
1,246
Sq Ft
$205/Sq Ft
Est. Value
About This Home
This home is located at 69 Turner St, Willimantic, CT 06226 and is currently estimated at $255,809, approximately $205 per square foot. 69 Turner St is a home located in Windham County with nearby schools including Windham Middle School, Windham High School, and St Mary St Joseph School.
Ownership History
Date
Name
Owned For
Owner Type
Purchase Details
Closed on
May 24, 2012
Sold by
Le Phuong
Bought by
Le Quynh
Current Estimated Value
Purchase Details
Closed on
Sep 4, 2007
Sold by
Garcia Richard and Garcia Gesela
Bought by
Le Quynh and Le Phuong
Home Financials for this Owner
Home Financials are based on the most recent Mortgage that was taken out on this home.
Original Mortgage
$180,000
Interest Rate
6.71%
Mortgage Type
Purchase Money Mortgage
Purchase Details
Closed on
Apr 6, 2000
Sold by
Cain Nellie Est and Cain
Bought by
Garcia Richard and Shatz Aisela
Home Financials for this Owner
Home Financials are based on the most recent Mortgage that was taken out on this home.
Original Mortgage
$54,800
Interest Rate
8.63%
Mortgage Type
Purchase Money Mortgage
Create a Home Valuation Report for This Property
The Home Valuation Report is an in-depth analysis detailing your home's value as well as a comparison with similar homes in the area
Home Values in the Area
Average Home Value in this Area
Purchase History
| Date | Buyer | Sale Price | Title Company |
|---|---|---|---|
| Le Quynh | -- | -- | |
| Le Quynh | $90,000 | -- | |
| Garcia Richard | $62,000 | -- |
Source: Public Records
Mortgage History
| Date | Status | Borrower | Loan Amount |
|---|---|---|---|
| Previous Owner | Garcia Richard | $180,000 | |
| Previous Owner | Garcia Richard | $150,000 | |
| Previous Owner | Garcia Richard | $96,000 | |
| Previous Owner | Garcia Richard | $54,800 |
Source: Public Records
Tax History
| Year | Tax Paid | Tax Assessment Tax Assessment Total Assessment is a certain percentage of the fair market value that is determined by local assessors to be the total taxable value of land and additions on the property. | Land | Improvement |
|---|---|---|---|---|
| 2025 | $5,003 | $135,140 | $24,710 | $110,430 |
| 2024 | $5,008 | $135,140 | $24,710 | $110,430 |
| 2023 | $3,591 | $75,770 | $21,490 | $54,280 |
| 2022 | $3,538 | $75,770 | $21,490 | $54,280 |
| 2021 | $3,795 | $75,770 | $21,490 | $54,280 |
| 2020 | $3,787 | $75,770 | $21,490 | $54,280 |
| 2019 | $3,726 | $75,770 | $21,490 | $54,280 |
| 2017 | $3,548 | $74,520 | $21,320 | $53,200 |
| 2015 | $3,426 | $74,520 | $21,320 | $53,200 |
| 2014 | $3,236 | $74,520 | $21,320 | $53,200 |
Source: Public Records
Map
Nearby Homes
Your Personal Tour Guide
Ask me questions while you tour the home.