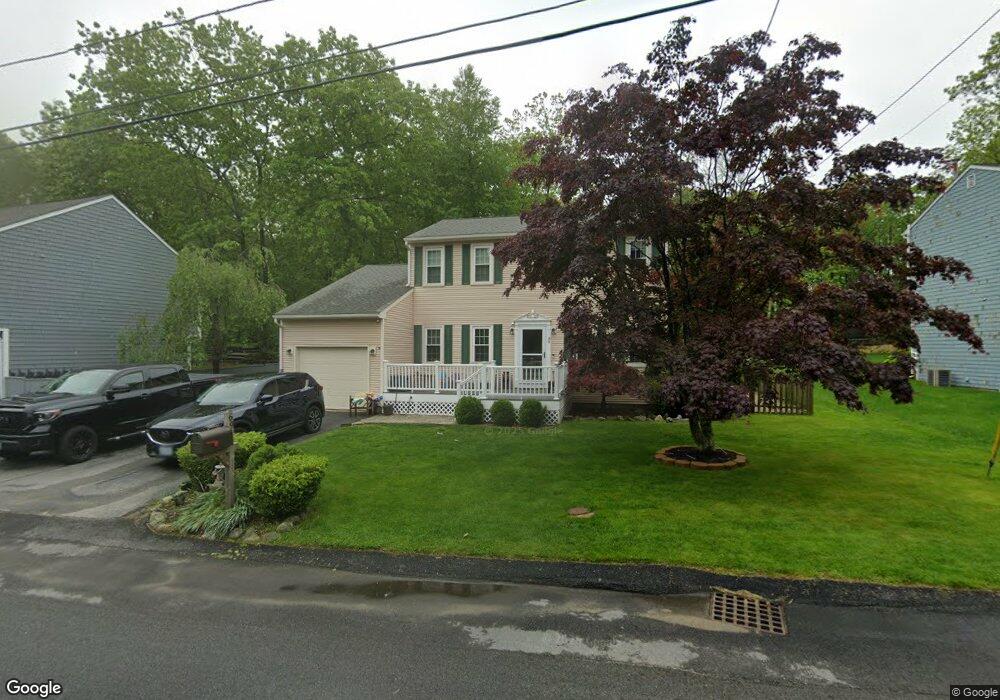
69 Walden Way Unit 69 Cranston, RI 02921
Western Cranston NeighborhoodEstimated Value: $502,930 - $567,000
3
Beds
3
Baths
2,016
Sq Ft
$269/Sq Ft
Est. Value
About This Home
This home is located at 69 Walden Way Unit 69, Cranston, RI 02921 and is currently estimated at $541,483, approximately $268 per square foot. 69 Walden Way Unit 69 is a home located in Providence County with nearby schools including Oak Lawn School, Western Hills Middle School, and Cranston High School West.
Ownership History
Date
Name
Owned For
Owner Type
Purchase Details
Closed on
Aug 18, 2017
Sold by
Tung Rebecca L and Tung Jeremy M
Bought by
Vala Robert and Vala Tracy
Current Estimated Value
Home Financials for this Owner
Home Financials are based on the most recent Mortgage that was taken out on this home.
Original Mortgage
$253,425
Outstanding Balance
$211,464
Interest Rate
3.96%
Mortgage Type
Purchase Money Mortgage
Estimated Equity
$330,019
Purchase Details
Closed on
Jan 31, 2007
Sold by
Saxton Donald and Saxton Denise
Bought by
Tung Jeremy and Tung Rebecca
Home Financials for this Owner
Home Financials are based on the most recent Mortgage that was taken out on this home.
Original Mortgage
$227,000
Interest Rate
6.16%
Mortgage Type
Purchase Money Mortgage
Purchase Details
Closed on
Jun 21, 2004
Sold by
Krin Barry and Krin Elaine
Bought by
Saxton Donald and Saxton Denise
Create a Home Valuation Report for This Property
The Home Valuation Report is an in-depth analysis detailing your home's value as well as a comparison with similar homes in the area
Home Values in the Area
Average Home Value in this Area
Purchase History
| Date | Buyer | Sale Price | Title Company |
|---|---|---|---|
| Vala Robert | $272,500 | -- | |
| Tung Jeremy | $325,000 | -- | |
| Saxton Donald | $310,000 | -- |
Source: Public Records
Mortgage History
| Date | Status | Borrower | Loan Amount |
|---|---|---|---|
| Open | Saxton Donald | $253,425 | |
| Previous Owner | Saxton Donald | $219,081 | |
| Previous Owner | Saxton Donald | $227,000 |
Source: Public Records
Tax History Compared to Growth
Tax History
| Year | Tax Paid | Tax Assessment Tax Assessment Total Assessment is a certain percentage of the fair market value that is determined by local assessors to be the total taxable value of land and additions on the property. | Land | Improvement |
|---|---|---|---|---|
| 2025 | $5,209 | $375,300 | $147,100 | $228,200 |
| 2024 | $5,108 | $375,300 | $147,100 | $228,200 |
| 2023 | $5,727 | $303,000 | $105,200 | $197,800 |
| 2022 | $5,609 | $303,000 | $105,200 | $197,800 |
| 2021 | $5,454 | $303,000 | $105,200 | $197,800 |
| 2020 | $5,386 | $259,300 | $105,200 | $154,100 |
| 2019 | $5,386 | $259,300 | $105,200 | $154,100 |
| 2018 | $5,261 | $259,300 | $105,200 | $154,100 |
| 2017 | $5,572 | $242,900 | $90,200 | $152,700 |
| 2016 | $5,453 | $242,900 | $90,200 | $152,700 |
| 2015 | $5,453 | $242,900 | $90,200 | $152,700 |
| 2014 | $5,002 | $219,000 | $86,400 | $132,600 |
Source: Public Records
Map
Nearby Homes
- 99 Walden Way
- 51 Gilcrest Dr
- 8 Lily Ln Unit 8
- 15 Carrie Ann Dr
- 63 Governors Hill Unit 63
- 550 Wakefield St Unit 3
- 1 Countryside Way
- 2212 Phenix Ave
- 14 Vincenzo Dr
- 312 Wakefield St
- 0 Natick Rd
- 71 Steven Dr
- 46 Hoover St
- 3 Apple Blossom Way
- 5 Cyr Ct
- 1715 Phenix Ave
- 10 Scarlett Way
- 89 Lowell St
- 25 Wilson St
- 61 Crossland Rd
- 69 Walden Way
- 75 Walden Way
- 65 Walden Way
- 2 Beaver Creek Ct
- 3 Beaver Creek Ct
- 81 Walden Way
- 57 Walden Way
- 6 Beaver Creek Ct
- 78 Walden Way
- 50 Walden Way
- 5 Beaver Creek Ct
- 88 Walden Way
- 8 Beaver Creek Ct
- 55 Walden Way
- 9 Beaver Creek Ct
- 46 Walden Way
- 90 Walden Way
- 10 Beaver Creek Ct
- 95 Walden Way
- 45 Walden Way