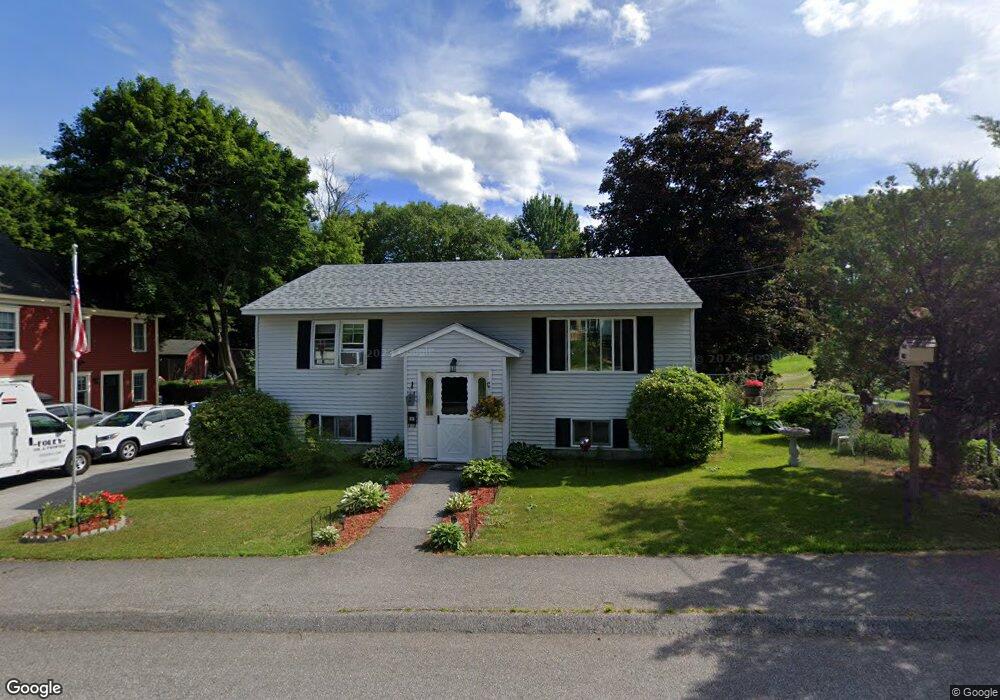
69 Warren St Laconia, NH 03246
Estimated Value: $332,000 - $346,000
3
Beds
1
Bath
888
Sq Ft
$383/Sq Ft
Est. Value
About This Home
This home is located at 69 Warren St, Laconia, NH 03246 and is currently estimated at $340,064, approximately $382 per square foot. 69 Warren St is a home located in Belknap County with nearby schools including Laconia Middle School, Laconia High School, and Holy Trinity Catholic School.
Ownership History
Date
Name
Owned For
Owner Type
Purchase Details
Closed on
Aug 12, 2024
Sold by
Colcord Donna M
Bought by
Donna M Colcord Ret and Colcord
Current Estimated Value
Purchase Details
Closed on
Jun 28, 1996
Sold by
Bond Janet M
Bought by
Paradise Mary
Home Financials for this Owner
Home Financials are based on the most recent Mortgage that was taken out on this home.
Original Mortgage
$76,630
Interest Rate
8.05%
Create a Home Valuation Report for This Property
The Home Valuation Report is an in-depth analysis detailing your home's value as well as a comparison with similar homes in the area
Home Values in the Area
Average Home Value in this Area
Purchase History
| Date | Buyer | Sale Price | Title Company |
|---|---|---|---|
| Donna M Colcord Ret | -- | None Available | |
| Donna M Colcord Ret | -- | None Available | |
| Paradise Mary | $79,000 | -- | |
| Paradise Mary | $79,000 | -- |
Source: Public Records
Mortgage History
| Date | Status | Borrower | Loan Amount |
|---|---|---|---|
| Previous Owner | Paradise Mary | $76,630 |
Source: Public Records
Tax History Compared to Growth
Tax History
| Year | Tax Paid | Tax Assessment Tax Assessment Total Assessment is a certain percentage of the fair market value that is determined by local assessors to be the total taxable value of land and additions on the property. | Land | Improvement |
|---|---|---|---|---|
| 2024 | $3,853 | $282,700 | $120,000 | $162,700 |
| 2023 | $3,683 | $264,800 | $109,900 | $154,900 |
| 2022 | $3,374 | $227,200 | $93,300 | $133,900 |
| 2021 | $3,353 | $177,800 | $61,900 | $115,900 |
| 2020 | $3,262 | $165,400 | $52,700 | $112,700 |
| 2019 | $3,354 | $162,900 | $48,100 | $114,800 |
| 2018 | $3,413 | $163,700 | $46,800 | $116,900 |
| 2017 | $3,199 | $152,100 | $45,900 | $106,200 |
| 2016 | $3,024 | $136,200 | $45,900 | $90,300 |
| 2015 | $3,310 | $149,100 | $48,200 | $100,900 |
| 2014 | $3,167 | $141,400 | $48,000 | $93,400 |
| 2013 | $3,067 | $138,900 | $45,500 | $93,400 |
Source: Public Records
Map
Nearby Homes