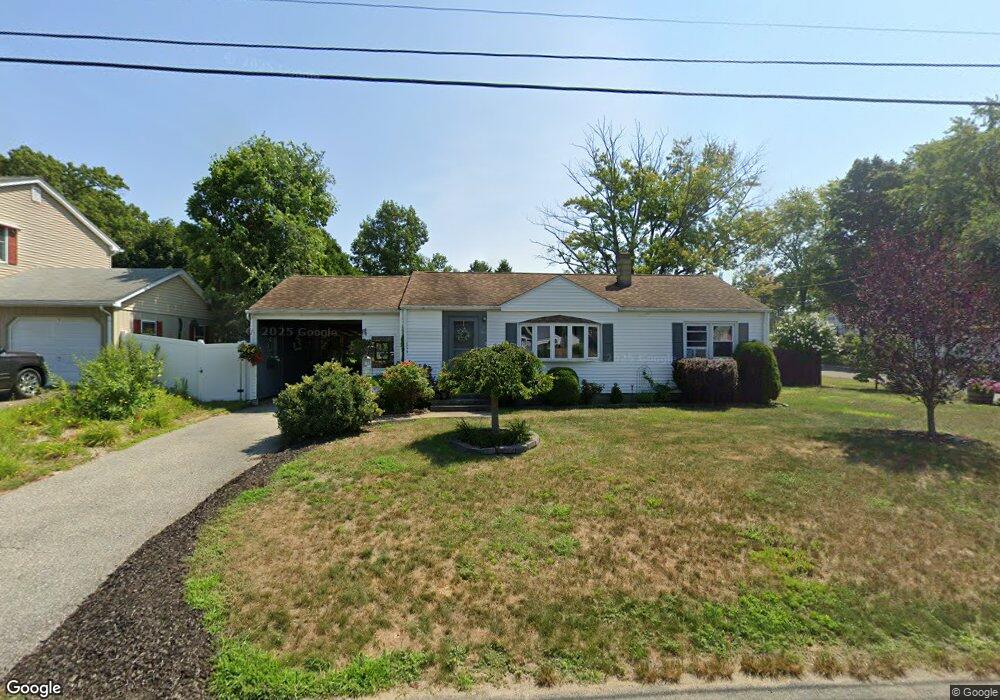
69 Westport Dr Chicopee, MA 01020
Fairview NeighborhoodEstimated Value: $283,935 - $339,000
3
Beds
1
Bath
912
Sq Ft
$332/Sq Ft
Est. Value
About This Home
This home is located at 69 Westport Dr, Chicopee, MA 01020 and is currently estimated at $303,234, approximately $332 per square foot. 69 Westport Dr is a home located in Hampden County with nearby schools including Bowie Elementary School, Fairview Middle School, and Chicopee Comprehensive High School.
Ownership History
Date
Name
Owned For
Owner Type
Purchase Details
Closed on
Apr 30, 2010
Sold by
Barnes Theresa M
Bought by
Hebert Danielle L and Guilbert Christopher R
Current Estimated Value
Home Financials for this Owner
Home Financials are based on the most recent Mortgage that was taken out on this home.
Original Mortgage
$159,556
Outstanding Balance
$104,970
Interest Rate
4.99%
Mortgage Type
Purchase Money Mortgage
Estimated Equity
$198,264
Create a Home Valuation Report for This Property
The Home Valuation Report is an in-depth analysis detailing your home's value as well as a comparison with similar homes in the area
Home Values in the Area
Average Home Value in this Area
Purchase History
| Date | Buyer | Sale Price | Title Company |
|---|---|---|---|
| Hebert Danielle L | $162,500 | -- |
Source: Public Records
Mortgage History
| Date | Status | Borrower | Loan Amount |
|---|---|---|---|
| Open | Hebert Danielle L | $159,556 |
Source: Public Records
Tax History
| Year | Tax Paid | Tax Assessment Tax Assessment Total Assessment is a certain percentage of the fair market value that is determined by local assessors to be the total taxable value of land and additions on the property. | Land | Improvement |
|---|---|---|---|---|
| 2025 | $3,632 | $239,600 | $111,400 | $128,200 |
| 2024 | $3,449 | $233,700 | $109,200 | $124,500 |
| 2023 | $3,262 | $215,300 | $99,200 | $116,100 |
| 2022 | $3,128 | $184,100 | $86,300 | $97,800 |
| 2021 | $2,967 | $168,500 | $78,400 | $90,100 |
| 2020 | $2,881 | $165,000 | $80,600 | $84,400 |
| 2019 | $2,859 | $159,200 | $80,600 | $78,600 |
| 2018 | $2,796 | $152,700 | $76,800 | $75,900 |
| 2017 | $2,712 | $156,700 | $70,400 | $86,300 |
| 2016 | $2,530 | $149,600 | $70,400 | $79,200 |
| 2015 | $2,520 | $143,700 | $70,400 | $73,300 |
| 2014 | $1,260 | $143,700 | $70,400 | $73,300 |
Source: Public Records
Map
Nearby Homes
- 52 Falmouth Rd
- 70 Greenwood Terrace
- 58 Robinridge Rd
- 119 Oakridge St
- 37 Greenwood Terrace
- 460 Irene St
- 67 Streiber Dr
- 144 Horseshoe Dr
- 156 Horseshoe Dr
- 83 Old Farm Rd
- 1697 Westover Rd
- 104 Johnson Rd Unit 1103
- 104 Johnson Rd Unit 707
- 111 Festival Cir
- 523 James St
- 81 Mccarthy Ave
- 14 Dorothy Ave
- 130 Celebration Cir
- 107 Beauregard Terrace
- 1709 Memorial Dr
Your Personal Tour Guide
Ask me questions while you tour the home.