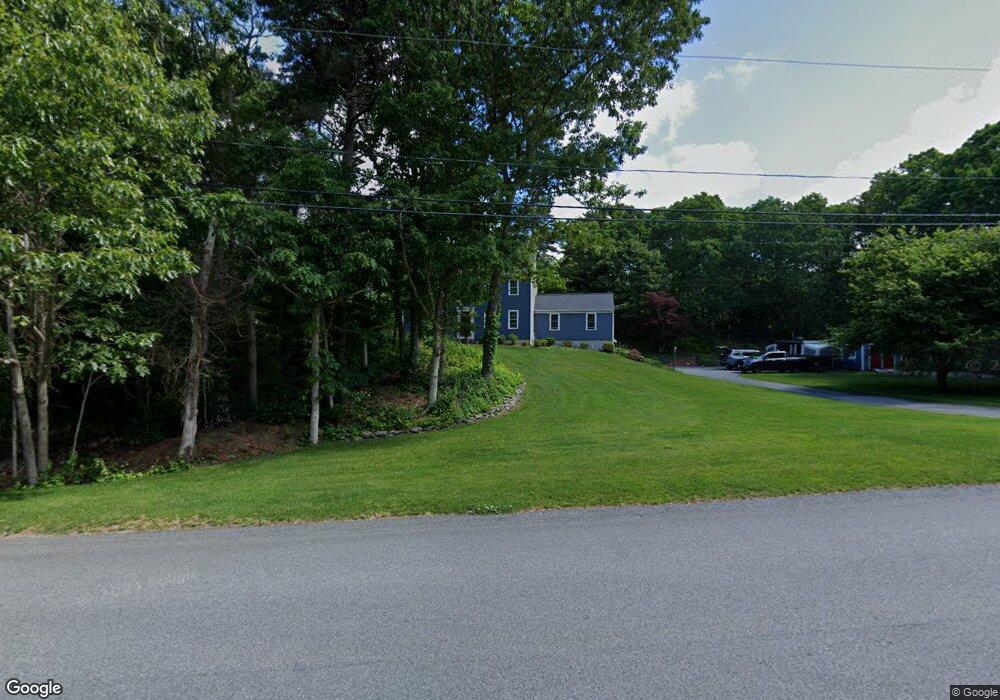
690 Cedar St West Barnstable, MA 02668
West Barnstable NeighborhoodEstimated Value: $754,000 - $889,000
3
Beds
2
Baths
2,036
Sq Ft
$397/Sq Ft
Est. Value
About This Home
This home is located at 690 Cedar St, West Barnstable, MA 02668 and is currently estimated at $807,979, approximately $396 per square foot. 690 Cedar St is a home located in Barnstable County with nearby schools including West Barnstable Elementary School, Barnstable United Elementary School, and Barnstable Intermediate School.
Ownership History
Date
Name
Owned For
Owner Type
Purchase Details
Closed on
Jan 10, 2011
Sold by
Duenas Terry T and Duenas Susan V
Bought by
Duenas Terry T
Current Estimated Value
Purchase Details
Closed on
Sep 26, 1994
Sold by
Resources Grp
Bought by
Duenas Terry T
Home Financials for this Owner
Home Financials are based on the most recent Mortgage that was taken out on this home.
Original Mortgage
$128,100
Interest Rate
8.56%
Mortgage Type
Purchase Money Mortgage
Purchase Details
Closed on
May 19, 1994
Sold by
Cedar St W Barn Rt and Princi Michael J
Bought by
Resources Group T and Priestly Donald H
Create a Home Valuation Report for This Property
The Home Valuation Report is an in-depth analysis detailing your home's value as well as a comparison with similar homes in the area
Home Values in the Area
Average Home Value in this Area
Purchase History
| Date | Buyer | Sale Price | Title Company |
|---|---|---|---|
| Duenas Terry T | -- | -- | |
| Duenas Terry T | $134,900 | -- | |
| Resources Group T | $30,000 | -- |
Source: Public Records
Mortgage History
| Date | Status | Borrower | Loan Amount |
|---|---|---|---|
| Previous Owner | Resources Group T | $25,000 | |
| Previous Owner | Resources Group T | $128,000 | |
| Previous Owner | Resources Group T | $128,100 |
Source: Public Records
Tax History
| Year | Tax Paid | Tax Assessment Tax Assessment Total Assessment is a certain percentage of the fair market value that is determined by local assessors to be the total taxable value of land and additions on the property. | Land | Improvement |
|---|---|---|---|---|
| 2025 | $7,066 | $756,500 | $178,200 | $578,300 |
| 2024 | $6,151 | $716,900 | $178,200 | $538,700 |
| 2023 | $5,664 | $621,700 | $162,200 | $459,500 |
| 2022 | $5,558 | $500,300 | $120,700 | $379,600 |
| 2021 | $5,493 | $468,700 | $120,700 | $348,000 |
| 2020 | $5,410 | $446,400 | $129,600 | $316,800 |
| 2019 | $5,280 | $430,000 | $129,600 | $300,400 |
| 2018 | $4,884 | $394,200 | $136,400 | $257,800 |
| 2017 | $4,530 | $370,100 | $136,400 | $233,700 |
| 2016 | $4,449 | $371,100 | $137,400 | $233,700 |
| 2015 | $4,284 | $358,200 | $131,600 | $226,600 |
Source: Public Records
Map
Nearby Homes
- 75 Old Toll Rd
- 50 Wayside Ln
- 510 Cedar St
- 6 Harpers Hollow
- 46 Service Rd
- 159 Great Hill Rd
- 3 Mulberry Cir
- 29 Fish House Rd
- 84 White Birch Way
- 4 Wing Blvd
- 566 Route 6a
- 0 Captain Kidd Rd
- 282 Parker Rd
- 6 George Gallant Rd
- 507 Route 6a Unit 9
- 50 Currycomb Cir
- 32 Willington Ave
- 82 Old Fields Rd
- 74 Saddler Ln
- 23 Old Fields Rd
- 35 Lothrops Ln
- 16 Lothrups
- 717 Cedar St
- 10 Berkshire Trail
- 675 Cedar St
- 740 Cedar St
- 57 Lothrops Ln
- 15 Berkshire Trail
- 650 Cedar St
- 731 Cedar St
- 16 Lothrops Ln
- 28 Lothrops Ln
- 40 Lothrops Ln
- 40 Lothrop's Ln
- 30 Berkshire Trail
- 71 Lothrops Ln
- 10 Crocker Rd
- 35 Berkshire Trail
- 629 Cedar St
- 56 Lothrops Ln
Your Personal Tour Guide
Ask me questions while you tour the home.