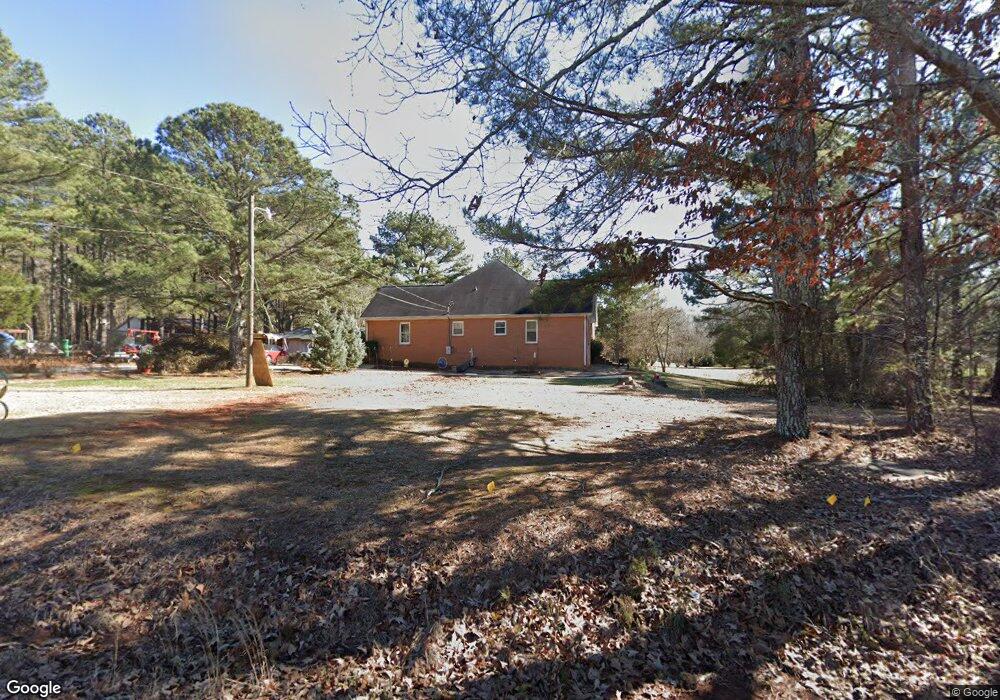
690 Frost Rd SE Monroe, GA 30655
Estimated Value: $508,000 - $634,000
3
Beds
2
Baths
2,928
Sq Ft
$200/Sq Ft
Est. Value
About This Home
This home is located at 690 Frost Rd SE, Monroe, GA 30655 and is currently estimated at $584,996, approximately $199 per square foot. 690 Frost Rd SE is a home located in Walton County with nearby schools including Harmony Elementary School, Carver Middle School, and Monroe Area High School.
Ownership History
Date
Name
Owned For
Owner Type
Purchase Details
Closed on
Apr 29, 2019
Sold by
Tucker Jeremy A
Bought by
Tucker Jeremy A and Tucker Jeeranan
Current Estimated Value
Purchase Details
Closed on
Aug 21, 2015
Sold by
Peters Eva Oneida Estate
Bought by
Tucker Jeremy A
Home Financials for this Owner
Home Financials are based on the most recent Mortgage that was taken out on this home.
Original Mortgage
$208,160
Interest Rate
3.75%
Mortgage Type
FHA
Purchase Details
Closed on
Nov 8, 2013
Sold by
Peters Eva Oneida Stanley
Bought by
Tucker Vivian P
Purchase Details
Closed on
Aug 28, 2013
Sold by
Tucker Vivian P
Bought by
Tucker Vivian P
Purchase Details
Closed on
Aug 1, 1989
Bought by
Peters Peters H and Peters Oneida S
Create a Home Valuation Report for This Property
The Home Valuation Report is an in-depth analysis detailing your home's value as well as a comparison with similar homes in the area
Home Values in the Area
Average Home Value in this Area
Purchase History
| Date | Buyer | Sale Price | Title Company |
|---|---|---|---|
| Tucker Jeremy A | -- | -- | |
| Tucker Jeremy A | $212,000 | -- | |
| Tucker Vivian P | $15,000 | -- | |
| Tucker Vivian P | -- | -- | |
| Tucker Vivian P | -- | -- | |
| Peters Peters H | $8,700 | -- |
Source: Public Records
Mortgage History
| Date | Status | Borrower | Loan Amount |
|---|---|---|---|
| Previous Owner | Tucker Jeremy A | $208,160 |
Source: Public Records
Tax History Compared to Growth
Tax History
| Year | Tax Paid | Tax Assessment Tax Assessment Total Assessment is a certain percentage of the fair market value that is determined by local assessors to be the total taxable value of land and additions on the property. | Land | Improvement |
|---|---|---|---|---|
| 2024 | $4,570 | $188,560 | $36,920 | $151,640 |
| 2023 | $4,503 | $174,920 | $35,000 | $139,920 |
| 2022 | $4,378 | $155,840 | $31,320 | $124,520 |
| 2021 | $4,089 | $134,840 | $24,320 | $110,520 |
| 2020 | $4,049 | $128,040 | $21,120 | $106,920 |
| 2019 | $3,901 | $116,120 | $18,760 | $97,360 |
| 2018 | $3,883 | $116,120 | $18,760 | $97,360 |
| 2017 | $3,913 | $113,560 | $18,760 | $94,800 |
| 2016 | $3,226 | $95,000 | $14,640 | $80,360 |
| 2015 | $3,155 | $91,440 | $14,640 | $76,800 |
| 2014 | $3,189 | $90,120 | $0 | $0 |
Source: Public Records
Map
Nearby Homes
- 2433 Waterside Dr
- 2412 Waterside Dr
- 511 Alcovy Lakes Dr
- 569 Highway 11 SW
- 2560 Whitney Rd SE
- 1119 Heights View Way
- 709 White Oak Trail
- 2590 Walton Downs Rd
- 2590 Walton Downs Rd Unit 3
- 1334 Criswell Rd SE
- 1149 Criswell Rd SE
- 1169 Dean Hill Rd SE
- 1229 Dean Hill Rd
- 1009 Dean Hill Rd SE
- 1720 Brush Creek Dr
- 564 White Oak Way
- 569 White Oak Way
- 0 Dial Rd Unit 10443881
- 0 Dial Rd Unit 7506285
- 15 Dial Rd
- 691 Frost Rd SE
- 701 Frost Rd SE
- 411 Highway 11
- 685 Frost Rd SE
- 670 Frost Rd SE
- 681 Frost Rd SE
- 409 Georgia 11
- 429 Highway 11
- 429 State Highway 11
- 661 Frost Rd SE
- 630 Frost Rd SE
- 621 Frost Rd SE
- 631 Frost Rd SE
- 600 Frost Rd SE
- 641 Frost Rd SE
- 611 Frost Rd SE
- 590 Frost Rd SE
- 382 State Highway 11
- 380 State Highway 11
- 382 Georgia 11