Estimated Value: $311,000 - $377,000
3
Beds
3
Baths
2,163
Sq Ft
$153/Sq Ft
Est. Value
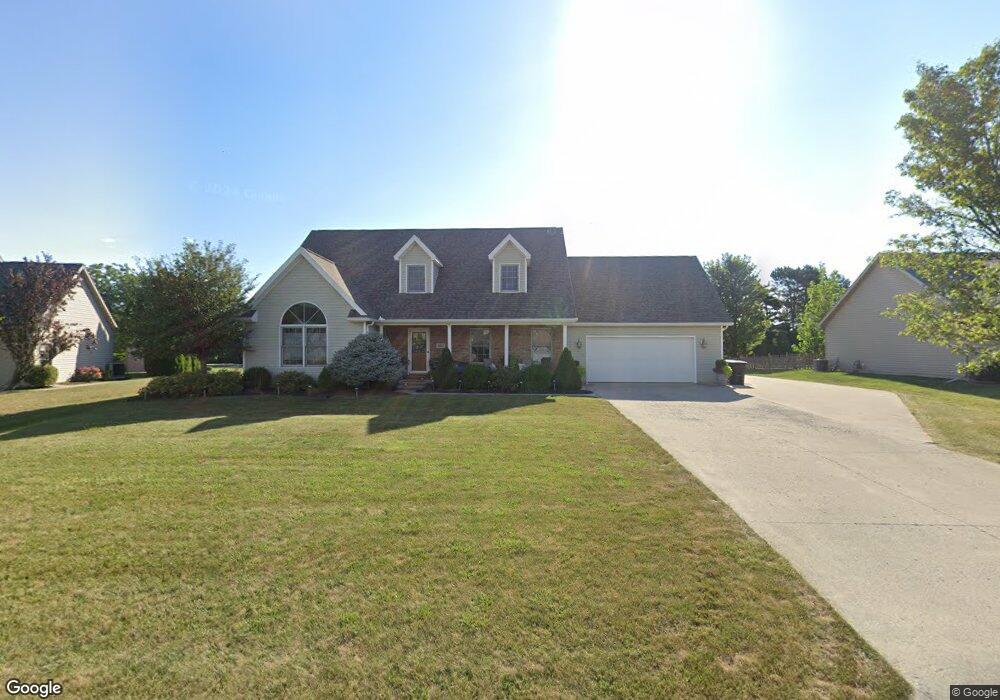
About This Home
This home is located at 690 Gardenview Cir, Lima, OH 45801 and is currently estimated at $331,906, approximately $153 per square foot. 690 Gardenview Cir is a home located in Allen County with nearby schools including Bath Elementary School, Bath Middle School, and Bath High School.
Ownership History
Date
Name
Owned For
Owner Type
Purchase Details
Closed on
Mar 25, 2002
Sold by
Boerke Alan J
Bought by
Stump David A and Stump Kimberly
Current Estimated Value
Home Financials for this Owner
Home Financials are based on the most recent Mortgage that was taken out on this home.
Original Mortgage
$141,000
Outstanding Balance
$58,443
Interest Rate
6.95%
Mortgage Type
New Conventional
Estimated Equity
$273,463
Purchase Details
Closed on
Aug 30, 2000
Sold by
Sterling Ray
Bought by
Boerke Alan J and Boerke Carole B
Home Financials for this Owner
Home Financials are based on the most recent Mortgage that was taken out on this home.
Original Mortgage
$154,350
Interest Rate
8.26%
Mortgage Type
New Conventional
Purchase Details
Closed on
Sep 21, 1998
Sold by
Quality Management
Bought by
Sterling Ray and Sterling Florence
Purchase Details
Closed on
May 1, 1998
Sold by
Armstrong Evonne
Bought by
Quality Management
Create a Home Valuation Report for This Property
The Home Valuation Report is an in-depth analysis detailing your home's value as well as a comparison with similar homes in the area
Purchase History
| Date | Buyer | Sale Price | Title Company |
|---|---|---|---|
| Stump David A | $186,000 | -- | |
| Boerke Alan J | $171,500 | -- | |
| Sterling Ray | $160,000 | -- | |
| Quality Management | $20,900 | -- |
Source: Public Records
Mortgage History
| Date | Status | Borrower | Loan Amount |
|---|---|---|---|
| Open | Stump David A | $141,000 | |
| Previous Owner | Boerke Alan J | $154,350 |
Source: Public Records
Tax History
| Year | Tax Paid | Tax Assessment Tax Assessment Total Assessment is a certain percentage of the fair market value that is determined by local assessors to be the total taxable value of land and additions on the property. | Land | Improvement |
|---|---|---|---|---|
| 2024 | $3,673 | $84,150 | $9,420 | $74,730 |
| 2023 | $3,486 | $77,220 | $8,650 | $68,570 |
| 2022 | $3,498 | $77,220 | $8,650 | $68,570 |
| 2021 | $3,625 | $77,220 | $8,650 | $68,570 |
| 2020 | $3,593 | $69,930 | $8,120 | $61,810 |
| 2019 | $3,593 | $69,930 | $8,120 | $61,810 |
| 2018 | $3,298 | $69,930 | $8,120 | $61,810 |
| 2017 | $3,077 | $59,640 | $8,120 | $51,520 |
| 2016 | $2,871 | $59,640 | $8,120 | $51,520 |
| 2015 | $2,873 | $59,640 | $8,120 | $51,520 |
| 2014 | $3,142 | $62,690 | $8,120 | $54,570 |
| 2013 | $3,144 | $62,690 | $8,120 | $54,570 |
Source: Public Records
Map
Nearby Homes
- 3746 Armstead Place
- 485 S Mumaugh Rd
- 115 Oakview Ct
- 3774 Mount Vernon Place Unit C
- 3786 Mount Vernon Place Unit A
- 3833 Harding Hwy
- 819 Canyon Dr
- 120 Barnsbury Dr
- 800 Heritage Dr
- 32 Lakeside Dr
- 108 Valley Way
- 304 Pinewood Cir
- 314 Devonshire Dr
- 591 Lakeridge Dr
- 303 Pinewood Cir
- 125 Kensington Cir
- 633 Canyon Dr
- 2230 N Dixie Hwy
- 2145 N Dixie Hwy Unit 80
- 2145 N Dixie Hwy Unit 11
- 678 Gardenview Cir
- 722 Gardenview Cir
- 656 Gardenview Cir
- 673 Gardenview Cir
- 781 Hefner Dr
- 651 Gardenview Cir
- 756 Hefner Dr
- 777 Hefner Dr
- 639 Gardenview Cir
- 624 Gardenview Cir
- 755 Hefner Dr
- 646 Country View Cir
- 638 Country View Cir
- 625 Gardenview Cir
- 733 Hefner Dr
- 614 Country View Cir
- 593 Gardenview Cir
Your Personal Tour Guide
Ask me questions while you tour the home.