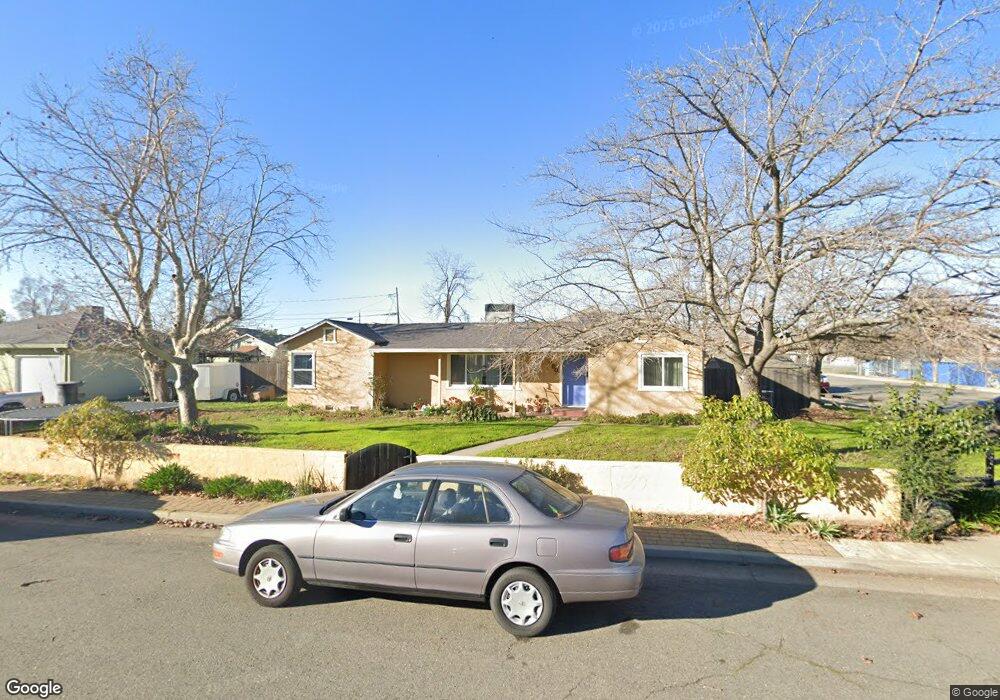
690 M St Lincoln, CA 95648
Estimated Value: $504,655 - $634,000
3
Beds
2
Baths
1,351
Sq Ft
$414/Sq Ft
Est. Value
About This Home
This home is located at 690 M St, Lincoln, CA 95648 and is currently estimated at $559,164, approximately $413 per square foot. 690 M St is a home located in Placer County with nearby schools including First Street, Glen Edwards Middle, and Lincoln High.
Ownership History
Date
Name
Owned For
Owner Type
Purchase Details
Closed on
May 23, 2007
Sold by
Oliver Barney M and Oliver Joan M
Bought by
Williams Roderick and Williams Katherine
Current Estimated Value
Home Financials for this Owner
Home Financials are based on the most recent Mortgage that was taken out on this home.
Original Mortgage
$309,000
Outstanding Balance
$248,872
Interest Rate
6.18%
Mortgage Type
Purchase Money Mortgage
Estimated Equity
$310,292
Purchase Details
Closed on
Apr 20, 2004
Sold by
Root Ray L and Root Joella F
Bought by
Oliver Barney M and Oliver Joan M
Home Financials for this Owner
Home Financials are based on the most recent Mortgage that was taken out on this home.
Original Mortgage
$147,200
Interest Rate
5.5%
Mortgage Type
Purchase Money Mortgage
Create a Home Valuation Report for This Property
The Home Valuation Report is an in-depth analysis detailing your home's value as well as a comparison with similar homes in the area
Home Values in the Area
Average Home Value in this Area
Purchase History
| Date | Buyer | Sale Price | Title Company |
|---|---|---|---|
| Williams Roderick | $309,000 | Chicago Title Company | |
| Oliver Barney M | $184,000 | North American Title |
Source: Public Records
Mortgage History
| Date | Status | Borrower | Loan Amount |
|---|---|---|---|
| Open | Williams Roderick | $309,000 | |
| Previous Owner | Oliver Barney M | $147,200 | |
| Closed | Oliver Barney M | $27,600 |
Source: Public Records
Tax History
| Year | Tax Paid | Tax Assessment Tax Assessment Total Assessment is a certain percentage of the fair market value that is determined by local assessors to be the total taxable value of land and additions on the property. | Land | Improvement |
|---|---|---|---|---|
| 2025 | $4,776 | $486,395 | $123,251 | $363,144 |
| 2023 | $4,776 | $397,902 | $118,466 | $279,436 |
| 2022 | $4,105 | $390,101 | $116,144 | $273,957 |
| 2021 | $3,965 | $377,000 | $112,200 | $264,800 |
| 2020 | $3,739 | $354,000 | $105,400 | $248,600 |
| 2019 | $3,789 | $361,000 | $107,500 | $253,500 |
| 2018 | $3,304 | $317,000 | $94,400 | $222,600 |
| 2017 | $3,262 | $317,000 | $94,400 | $222,600 |
| 2016 | $2,551 | $250,000 | $74,400 | $175,600 |
| 2015 | $2,461 | $243,000 | $72,300 | $170,700 |
| 2014 | $2,138 | $213,000 | $63,400 | $149,600 |
Source: Public Records
Map
Nearby Homes
- 604 P St
- 622 Q St
- 2730 Bedell St
- 394 Lincoln Blvd
- 1101 First St
- 1822 4th St
- 1848 Talavera Dr
- 2855 Porcelain St
- 2879 Porcelain St
- 2867 Porcelain St
- 1881 Talavera Dr
- 1743 Laehr Dr
- 430 Phoenix Cir
- 1917 Talavera Dr
- 1908 Talavera Dr
- 2004 Talavera Dr
- 1992 Talavera Dr
- 1920 Talavera Dr
- 1956 Talavera Dr
- 1944 Talavera Dr
Your Personal Tour Guide
Ask me questions while you tour the home.