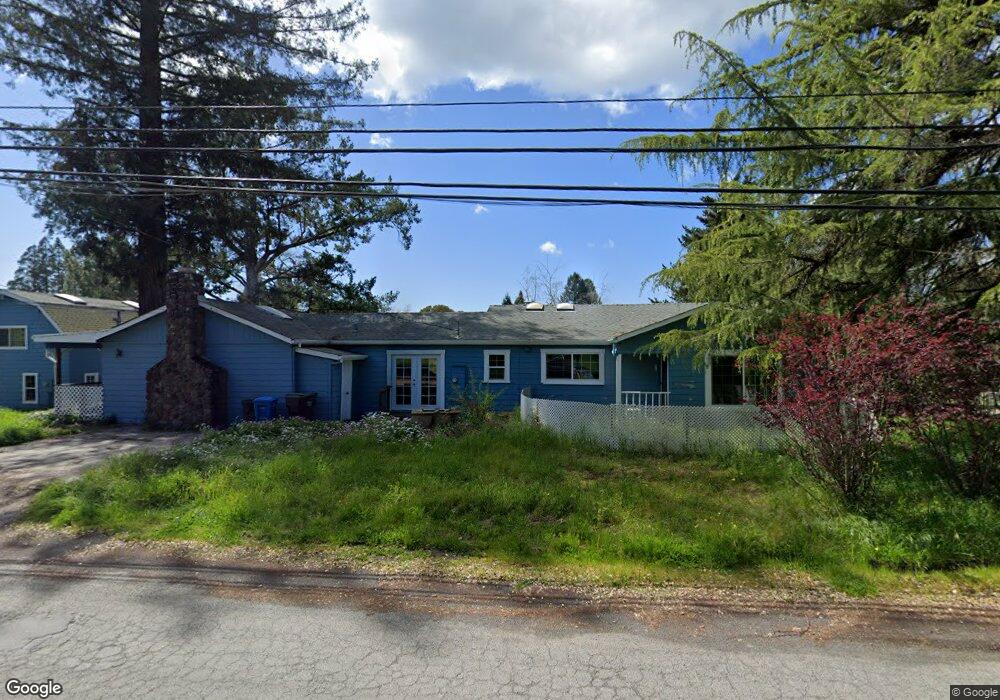
6900 Baker Ln Sebastopol, CA 95472
Estimated Value: $1,038,000 - $1,280,000
4
Beds
2
Baths
2,048
Sq Ft
$581/Sq Ft
Est. Value
About This Home
This home is located at 6900 Baker Ln, Sebastopol, CA 95472 and is currently estimated at $1,189,337, approximately $580 per square foot. 6900 Baker Ln is a home located in Sonoma County with nearby schools including Analy High School, Sunridge Charter School, and Gravenstein Elementary School.
Ownership History
Date
Name
Owned For
Owner Type
Purchase Details
Closed on
Aug 16, 2021
Sold by
David Watts Kenneth
Bought by
Watts Timothy A
Current Estimated Value
Purchase Details
Closed on
Jul 27, 2016
Sold by
Watts Kenneth D and Watts Carol
Bought by
Watts Kenneth D and Watts Carol W
Purchase Details
Closed on
Sep 28, 1995
Sold by
Motte Michael and Motte Eugenia
Bought by
Watts Kenneth D and Watts Carol
Home Financials for this Owner
Home Financials are based on the most recent Mortgage that was taken out on this home.
Original Mortgage
$299,500
Interest Rate
7.92%
Purchase Details
Closed on
Apr 26, 1994
Sold by
Tardibuono Forest J and Tardibuono Lynn
Bought by
Motte Michael and Motte Eugenia
Home Financials for this Owner
Home Financials are based on the most recent Mortgage that was taken out on this home.
Original Mortgage
$332,970
Interest Rate
7.79%
Mortgage Type
Seller Take Back
Create a Home Valuation Report for This Property
The Home Valuation Report is an in-depth analysis detailing your home's value as well as a comparison with similar homes in the area
Purchase History
We collect this data history from publicly available records. To have your information removed, we recommend requesting removal directly through your county’s website.
| Date | Buyer | Sale Price | Title Company |
|---|---|---|---|
| Watts Timothy A | -- | -- | |
| Watts Kenneth D | -- | None Available | |
| Watts Kenneth D | $399,500 | Old Republic Title Company | |
| Motte Michael | -- | Fidelity National Title Ins |
Source: Public Records
Mortgage History
We collect this data history from publicly available records. To have your information removed, we recommend requesting removal directly through your county’s website.
| Date | Status | Borrower | Loan Amount |
|---|---|---|---|
| Previous Owner | Watts Kenneth D | $299,500 | |
| Previous Owner | Motte Michael | $332,970 | |
| Closed | Motte Michael | $45,000 |
Source: Public Records
Tax History
| Year | Tax Paid | Tax Assessment Tax Assessment Total Assessment is a certain percentage of the fair market value that is determined by local assessors to be the total taxable value of land and additions on the property. | Land | Improvement |
|---|---|---|---|---|
| 2025 | $8,768 | $759,713 | $166,121 | $593,592 |
| 2024 | $8,619 | $744,817 | $162,864 | $581,953 |
| 2023 | $8,619 | $730,214 | $159,671 | $570,543 |
| 2022 | $8,454 | $715,897 | $156,541 | $559,356 |
| 2021 | $8,394 | $701,861 | $153,472 | $548,389 |
| 2020 | $8,405 | $694,665 | $151,899 | $542,766 |
| 2019 | $7,931 | $681,045 | $148,921 | $532,124 |
| 2018 | $7,814 | $667,692 | $146,001 | $521,691 |
| 2017 | $7,478 | $654,601 | $143,139 | $511,462 |
| 2016 | $7,359 | $641,767 | $140,333 | $501,434 |
| 2015 | $7,118 | $632,128 | $138,226 | $493,902 |
| 2014 | $6,977 | $619,747 | $135,519 | $484,228 |
Source: Public Records
Map
Nearby Homes
- 447 Sparkes Rd
- 243 Princeton Dr
- 3065 Pleasant Hill Rd
- 5932 Fredricks Rd
- 8030 Elphick Rd
- 1543 Cunningham Rd
- 1853 Cooper Rd
- 1171 Gravenstein Hwy S
- 7149 Lynch Rd
- 1136 Mcfarlane Ave
- 8099 Yule Tree Ln
- 7420 Woodland Ave
- 796 S High St
- 5301 Gravenstein Hwy S
- 3640 Gravenstein Hwy S
- 5111 Todd Rd
- 8400 Blackney Rd
- 5257 Mcfarlane Rd
- 789 Pleasant Hill Rd
- 486 S Main St
- 6881 Baker Ln
- 724 Sparkes Rd
- 6903 Baker Ln
- 706 Sparkes Rd
- 811 Misty Hills Ln
- 6982 Baker Ln
- 6832 Baker Ln
- 715 Sparkes Rd
- 825 Matsuda Ln
- 6800 Baker Ln
- 692 Sparkes Rd
- 6801 Baker Ln
- 829 Misty Hills Ln
- 695 Sparkes Rd
- 830 Misty Hills Ln
- 656 Sparkes Rd
- 6986 Baker Ln
- 699 Sparkes Rd
- 6794 Baker Ln
- 685 Sparkes Rd
Your Personal Tour Guide
Ask me questions while you tour the home.