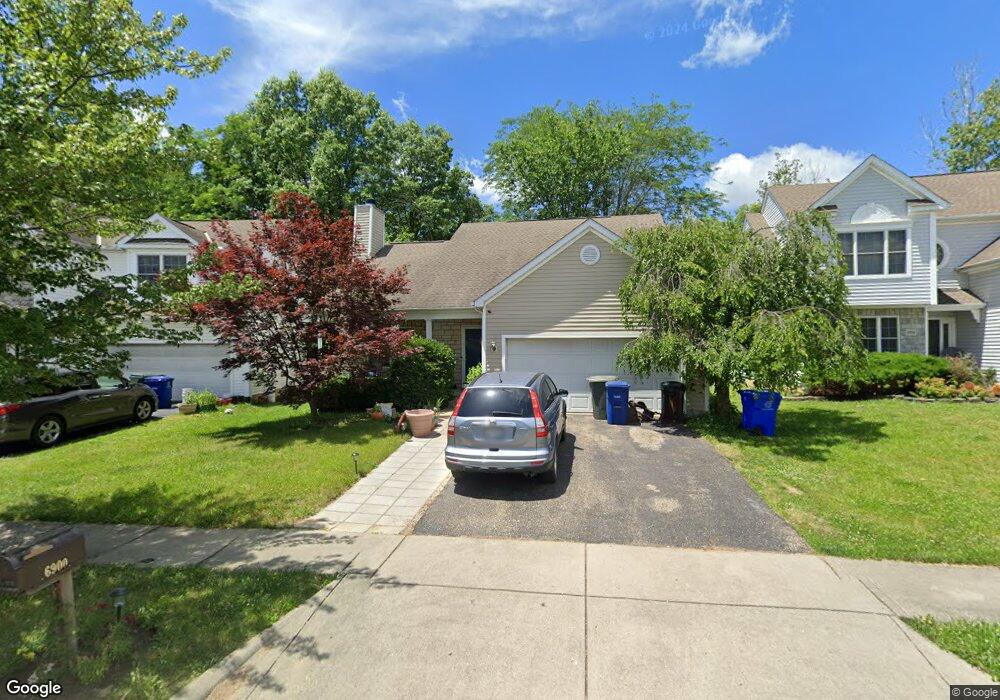
6900 Shady Rock Ln Blacklick, OH 43004
East Broad NeighborhoodEstimated Value: $331,000 - $367,955
3
Beds
2
Baths
1,752
Sq Ft
$198/Sq Ft
Est. Value
About This Home
This home is located at 6900 Shady Rock Ln, Blacklick, OH 43004 and is currently estimated at $346,489, approximately $197 per square foot. 6900 Shady Rock Ln is a home located in Franklin County with nearby schools including Blacklick Elementary School, Gahanna South Middle School, and Lincoln High School.
Ownership History
Date
Name
Owned For
Owner Type
Purchase Details
Closed on
Aug 22, 2012
Sold by
W & A Family Lp
Bought by
Taylor Jade C and Taylor Natalie A
Current Estimated Value
Home Financials for this Owner
Home Financials are based on the most recent Mortgage that was taken out on this home.
Original Mortgage
$130,591
Outstanding Balance
$89,181
Interest Rate
3.37%
Mortgage Type
FHA
Estimated Equity
$257,308
Purchase Details
Closed on
Jun 6, 2007
Sold by
Mtglq Investors Lp
Bought by
Parker Aileen
Purchase Details
Closed on
Nov 16, 2006
Sold by
Hsbc Mortgage Services Inc
Bought by
Mtglq Investors Lp
Purchase Details
Closed on
Sep 12, 2006
Sold by
Rhea Suzanne and Case #05Cve12 13586
Bought by
Hsbc Mortgage Services Inc
Purchase Details
Closed on
Jun 10, 2005
Sold by
Dominion Homes Inc
Bought by
Rhea Suzanne
Home Financials for this Owner
Home Financials are based on the most recent Mortgage that was taken out on this home.
Original Mortgage
$226,475
Interest Rate
8.8%
Mortgage Type
Fannie Mae Freddie Mac
Create a Home Valuation Report for This Property
The Home Valuation Report is an in-depth analysis detailing your home's value as well as a comparison with similar homes in the area
Home Values in the Area
Average Home Value in this Area
Purchase History
| Date | Buyer | Sale Price | Title Company |
|---|---|---|---|
| Taylor Jade C | $133,000 | None Available | |
| Parker Aileen | $110,000 | Fidelity Land Title Agency | |
| Mtglq Investors Lp | -- | Fidelity Land Title Agency | |
| Hsbc Mortgage Services Inc | $136,000 | None Available | |
| Rhea Suzanne | $226,500 | Alliance Ti |
Source: Public Records
Mortgage History
| Date | Status | Borrower | Loan Amount |
|---|---|---|---|
| Open | Taylor Jade C | $130,591 | |
| Previous Owner | Rhea Suzanne | $226,475 |
Source: Public Records
Tax History Compared to Growth
Tax History
| Year | Tax Paid | Tax Assessment Tax Assessment Total Assessment is a certain percentage of the fair market value that is determined by local assessors to be the total taxable value of land and additions on the property. | Land | Improvement |
|---|---|---|---|---|
| 2024 | $5,621 | $111,270 | $33,080 | $78,190 |
| 2023 | $5,541 | $111,265 | $33,075 | $78,190 |
| 2022 | $4,751 | $75,540 | $14,880 | $60,660 |
| 2021 | $4,758 | $75,540 | $14,880 | $60,660 |
| 2020 | $4,712 | $75,540 | $14,880 | $60,660 |
| 2019 | $3,689 | $60,130 | $11,900 | $48,230 |
| 2018 | $3,241 | $60,130 | $11,900 | $48,230 |
| 2017 | $3,334 | $60,130 | $11,900 | $48,230 |
| 2016 | $2,823 | $46,550 | $12,320 | $34,230 |
| 2015 | $2,825 | $46,550 | $12,320 | $34,230 |
| 2014 | $2,799 | $46,550 | $12,320 | $34,230 |
| 2013 | $1,707 | $57,260 | $12,320 | $44,940 |
Source: Public Records
Map
Nearby Homes
- 6924 Shady Rock Ln
- 7015 Onyxbluff Ln
- 240 MacEnroe Dr Unit 71D
- 201 MacEnroe Dr Unit 66C
- 184 MacAndrews Way Unit 44E
- 7204 Kirkdale Dr Unit 36C
- 167 MacEnroe Dr Unit 32B
- 414 Junction Crossing Dr
- 6396 Hoffman Trace Dr
- 186 Malloy Ln Unit 25c
- 184 Malloy Ln Unit 25D
- 170 Malloy Ln Unit 24C
- 7452 Call Rd Unit 99F
- 6343 Hoffman Trace Dr
- 208 Glenkirk Dr Unit 104B
- 1173 Jackson Hole Dr
- 160 Strathsprey Dr
- 625 Streamwater Dr
- 192 Strathsprey Dr
- 417 Hannifin Dr
- 6894 Shady Rock Ln
- 6894 Shady Rock Ln Unit 41
- 6906 Shady Rock Ln
- 6906 Shady Rock Ln Unit 39
- 6912 Shady Rock Ln
- 6882 Shady Rock Ln
- 6916 Granite Falls Dr
- 6911 Shady Rock Ln
- 6876 Shady Rock Ln
- 6924 Shady Rock Ln Unit 36
- 6922 Granite Falls Dr
- 6922 Granite Falls Dr Unit 112
- 6923 Shady Rock Ln
- 6923 Shady Rock Ln Unit 115
- 6870 Shady Rock Ln
- 6928 Granite Falls Dr
- 6930 Shady Rock Ln
- 6929 Shady Rock Ln
- 6929 Shady Rock Ln Unit 116
- 6915 Granite Falls Dr